


USD/JPY maintains uptrend, trading at 155.66 after hitting a daily low of 155.25.
Technical outlook suggests further gains with resistance at 156.05, 157.00, and YTD high at 160.32.
Key support levels include 155.18, 155.00, and May 16 low at 153.60 if price drops below 155.69.
The USD/JPY extended its gains late on Friday’s North American session, though it’s set to finish the week unchanged. The major trades at 155.66, up 0.18% after hitting a daily low of 155.25.
USD/JPY Price Analysis: Technical outlook
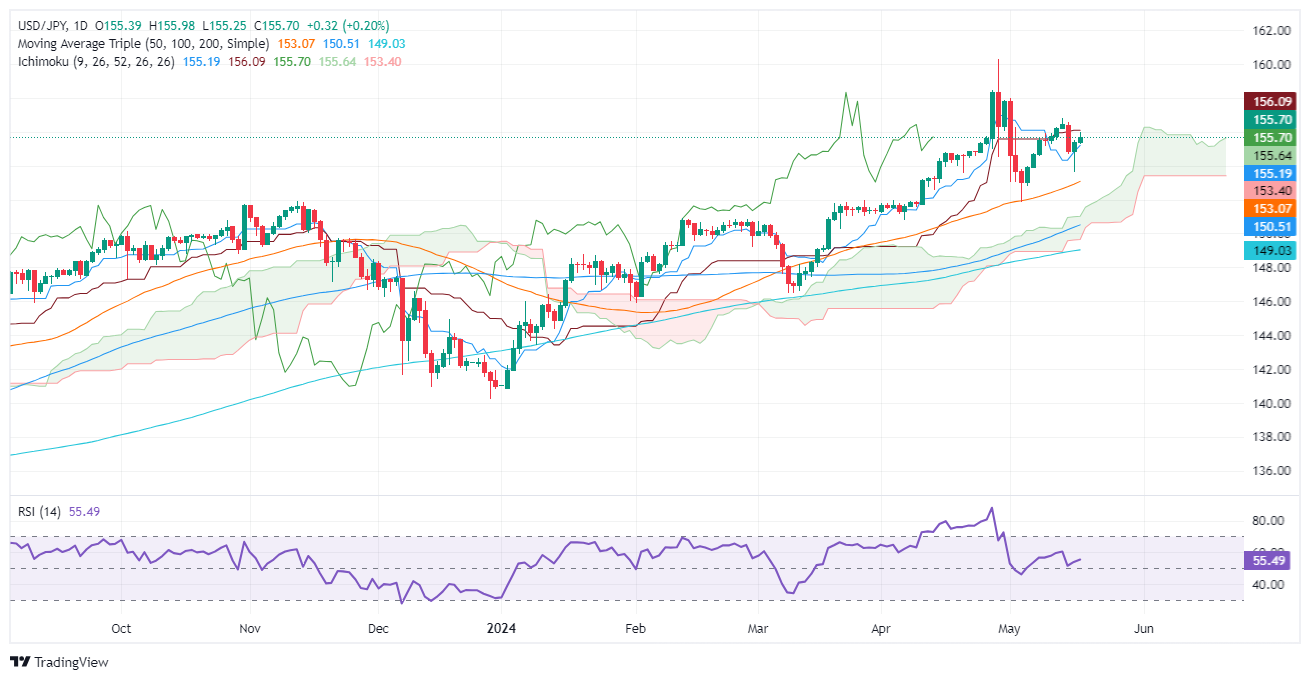
Despite the conditions to extend their gains, traders should be aware of the Japanese authority’s intervention threats. That said, the USD/JPY uptrend remains intact as long as price action achieves two goals: persisting above the Ichimoku Cloud (Kumo) and staying above the uptrend trendline drawn from the January 2024 lows.
The Relative Strength Index (RSI) favors buyers, standing above the 50-midline with enough room to spare before reaching overbought territory.
Therefore, the path of least resistance is upwards. The first resistance would be the Kijun-Sen at 156.05. Once cleared, the next stop would be 157.00, followed by the April 26 high of 158.44, ahead of challenging the year-to-date (YTD) high at 160.32.
On the flip side, if USD/JPY drops below the Senkou Span A of 155.69, the pair could be headed towards retesting lower support levels. Bulls’ first line of defense would be the Tenkan-Sen at 155.18, followed by 155.00. Once hurdled, the next stop would be the May 16 low of 153.60, followed by the Sekou Span B at 153.06.
USD/JPY Price Action – Daily Chart
Japanese Yen PRICE Today
The table below shows the percentage change of Japanese Yen (JPY) against listed major currencies today. Japanese Yen was the strongest against the Swiss Franc.
USD
EUR
GBP
JPY
CAD
AUD
NZD
CHF
USD
-0.02%
-0.25%
0.19%
-0.04%
-0.24%
-0.23%
0.30%
EUR
0.02%
-0.24%
0.22%
-0.01%
-0.20%
-0.19%
0.30%
GBP
0.25%
0.24%
0.44%
0.22%
0.04%
0.03%
0.53%
JPY
-0.19%
-0.22%
-0.44%
-0.26%
-0.43%
-0.45%
0.09%
CAD
0.04%
0.01%
-0.22%
0.26%
-0.19%
-0.18%
0.33%
AUD
0.24%
0.20%
-0.04%
0.43%
0.19%
0.00%
0.51%
NZD
0.23%
0.19%
-0.03%
0.45%
0.18%
-0.01%
0.51%
CHF
-0.30%
-0.30%
-0.53%
-0.09%
-0.33%
-0.51%
-0.51%
The heat map shows percentage changes of major currencies against each other. The base currency is picked from the left column, while the quote currency is picked from the top row. For example, if you pick the Japanese Yen from the left column and move along the horizontal line to the US Dollar, the percentage change displayed in the box will represent JPY (base)/USD (quote).
Information on these pages contains forward-looking statements that involve risks and uncertainties. Markets and instruments profiled on this page are for informational purposes only and should not in any way come across as a recommendation to buy or sell in these assets. You should do your own thorough research before making any investment decisions. FXStreet does not in any way guarantee that this information is free from mistakes, errors, or material misstatements. It also does not guarantee that this information is of a timely nature. Investing in Open Markets involves a great deal of risk, including the loss of all or a portion of your investment, as well as emotional distress. All risks, losses and costs associated with investing, including total loss of principal, are your responsibility. The views and opinions expressed in this article are those of the authors and do not necessarily reflect the official policy or position of FXStreet nor its advertisers. The author will not be held responsible for information that is found at the end of links posted on this page.
If not otherwise explicitly mentioned in the body of the article, at the time of writing, the author has no position in any stock mentioned in this article and no business relationship with any company mentioned. The author has not received compensation for writing this article, other than from FXStreet.
FXStreet and the author do not provide personalized recommendations. The author makes no representations as to the accuracy, completeness, or suitability of this information. FXStreet and the author will not be liable for any errors, omissions or any losses, injuries or damages arising from this information and its display or use. Errors and omissions excepted.
The author and FXStreet are not registered investment advisors and nothing in this article is intended to be investment advice.
>>> Read full article>>>
Copyright for syndicated content belongs to the linked Source : FXStreet – https://www.fxstreet.com/news/usd-jpy-price-analysis-extends-gains-but-remains-below-15600-202405172044

