

Australian Dollar halts its winning streak amid a tepid US Dollar.
Australia’s S&P/ASX 200 Index retreats from all-time highs as investors booked profits.
China’s CPI YoY and MoM increased by 0.7% and 1.0%, respectively, in February.
US Nonfarm Payrolls rose by 275K in February, surpassing the expected 200K and 229K prior.
The Australian Dollar (AUD) snaps its three-day winning streak on Monday, amid a weaker US Dollar (USD). The benchmark S&P/ASX 200 Index witnessed a decline at the beginning of the week, retreating notably from all-time highs as investors booked profits. The drop was particularly pronounced in the materials and healthcare sectors. Additionally, Australian shares followed a decline in technology stocks on Wall Street on Friday, which has tempered the strength of the AUD/USD pair.
Australian Dollar experienced a 1.60% gain against the US Dollar last week, driven by increasing expectations that the US Federal Reserve (Fed) will initiate interest rate cuts earlier than other major central banks. However, the Australian economy expanded less than anticipated in the fourth quarter, and the Trade Balance surplus fell short of expectations. These economic indicators highlight the argument for the Reserve Bank of Australia (RBA) to potentially consider rate cuts in the near future.
Investors will be closely monitoring a panel discussion at the AFR Business Summit in Sydney on Tuesday, where Sarah Hunter, Assistant Governor (Economics) at the Reserve Bank of Australia, may provide insights on domestic inflation trends. Additionally, attention will be on the release of the Australian Westpac Consumer Confidence for March and the US Consumer Price Index data for February, both scheduled for Tuesday.
Daily Digest Market Movers: Australian Dollar depreciates on weaker equity market
Australian Trade Balance (MoM) showed that the surplus increased to 11,027M in February, from 10,743M prior. The market expectation was an increase to 11,500M.
Australian Gross Domestic Product (GDP) grew by 0.2% QoQ in the fourth quarter of 2023, slightly below market expectations of no change at 0.3%. GDP (YoY) expanded by 1.5%, surpassing the expected 1.4%, but falling short of the previous growth of 2.1%.
Australia’s Treasurer, Jim Chalmers, has announced that the government will abolish nearly 500 import tariffs on a wide range of goods starting from July 1, 2024. This initiative aims to reduce compliance costs for businesses. By removing these tariffs, approximately A$8.5 billion worth of annual trade will be streamlined, leading to savings of over A$30 million in compliance costs for businesses each year.
In February, China’s Consumer Price Index (CPI) increased by 0.7% year-over-year, rebounding from a 0.8% decline in January and surpassing market expectations of a 0.3% rise. CPI inflation (MoM) rose by 1.0%, up from a 0.3% increase seen in January and exceeding the market consensus of 0.7%.
Chinese Producer Price Index (PPI) dropped by 2.7% YoY in February, compared to a 2.5% decline in January. This data came in weaker than market expectations, which anticipated a 2.5% decline.
Federal Reserve (Fed) Chair Jerome Powell, in his s testimony before the US Congress last week, reaffirmed the central bank’s position. Powell hinted at potential cuts in borrowing costs sometime this year. However, he emphasized that such actions would hinge on the inflation trajectory aligning with the Fed’s target of 2%.
Cleveland Fed President Loretta Mester addressed the Virtual European Economics and Financial Center, expressing concerns about the potential persistence of inflation throughout the year. She indicated that if the economy aligns with forecasts, there could be a likelihood of rate cuts later in the year.
According to the CME FedWatch Tool, there has been a slight decrease in the probability of a rate cut in March and May, with chances at 3.0% and 24.5%, respectively. However, the likelihood of a 25 basis points rate cut has increased to 57.2% for June.
US Nonfarm Payrolls increased by 275K in February, surpassing January’s figure of 229K and beating expectations of 200K.
US Average Hourly Earnings (YoY) grew by 4.3%, falling slightly below both February’s estimated and previous reading of 4.4%. On a monthly basis, there was an increase of 0.1%, which was lower than the anticipated 0.3% and the previous month’s 0.5%.
US Initial Jobless Claims were unchanged at 217K for the week ending on March 1, against the expected 215K.
US Nonfarm Productivity remained consistent at the growth of 3.2% in the fourth quarter of 2023, exceeding the market expectation of 3.1%.
February’s US ADP Employment Change came in at 140K against the expected 150K, increasing from 111K prior.
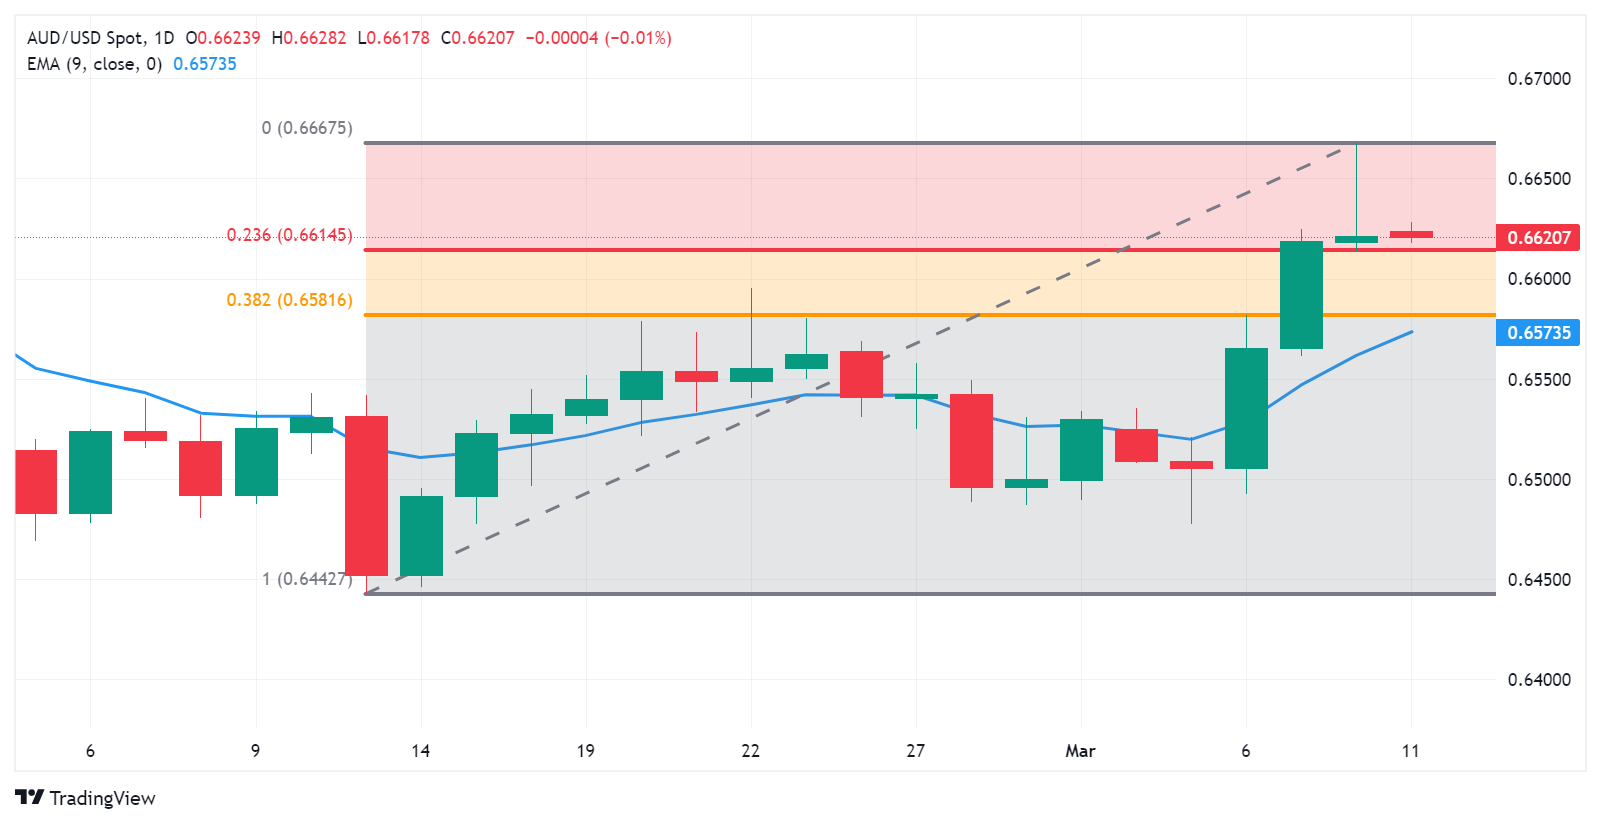
Technical Analysis: Australian Dollar hovers around 0.6620 followed by the previous week’s high
The Australian Dollar traded around 0.6620 on Monday. Key resistance appears at the major level of 0.6650, followed by the previous week’s high of 0.6667. A break above this level could support the pair to test the psychological barrier of 0.6700 level. On the downside, the immediate support appears at the 23.6% Fibonacci retracement level of 0.6614 followed by the psychological level of 0.6600. A break below the latter could push the AUD/USD pair to navigate the region around the 38.2% Fibonacci retracement level of 0.6581, aligned with the nine-day Exponential Moving Average (EMA) at 0.6574.
AUD/USD: Daily Chart

Australian Dollar price today
The table below shows the percentage change of Australian Dollar (AUD) against listed major currencies today. Australian Dollar was the weakest against the Canadian Dollar.
USD
EUR
GBP
CAD
AUD
JPY
NZD
CHF
USD
0.05%
0.04%
0.02%
0.21%
0.11%
0.11%
0.05%
EUR
-0.05%
-0.01%
-0.03%
0.16%
0.06%
0.06%
0.00%
GBP
-0.04%
0.01%
-0.03%
0.19%
0.08%
0.08%
0.01%
CAD
-0.01%
0.03%
0.00%
0.21%
0.08%
0.09%
0.02%
AUD
-0.21%
-0.16%
-0.18%
-0.21%
-0.11%
-0.10%
-0.16%
JPY
-0.09%
-0.06%
0.18%
-0.09%
0.11%
0.01%
-0.06%
NZD
-0.11%
-0.07%
-0.08%
-0.11%
0.10%
-0.01%
-0.07%
CHF
-0.03%
0.01%
0.00%
-0.02%
0.17%
0.05%
0.07%
The heat map shows percentage changes of major currencies against each other. The base currency is picked from the left column, while the quote currency is picked from the top row. For example, if you pick the Euro from the left column and move along the horizontal line to the Japanese Yen, the percentage change displayed in the box will represent EUR (base)/JPY (quote).
Inflation FAQs
Inflation measures the rise in the price of a representative basket of goods and services. Headline inflation is usually expressed as a percentage change on a month-on-month (MoM) and year-on-year (YoY) basis. Core inflation excludes more volatile elements such as food and fuel which can fluctuate because of geopolitical and seasonal factors. Core inflation is the figure economists focus on and is the level targeted by central banks, which are mandated to keep inflation at a manageable level, usually around 2%.
The Consumer Price Index (CPI) measures the change in prices of a basket of goods and services over a period of time. It is usually expressed as a percentage change on a month-on-month (MoM) and year-on-year (YoY) basis. Core CPI is the figure targeted by central banks as it excludes volatile food and fuel inputs. When Core CPI rises above 2% it usually results in higher interest rates and vice versa when it falls below 2%. Since higher interest rates are positive for a currency, higher inflation usually results in a stronger currency. The opposite is true when inflation falls.
Although it may seem counter-intuitive, high inflation in a country pushes up the value of its currency and vice versa for lower inflation. This is because the central bank will normally raise interest rates to combat the higher inflation, which attract more global capital inflows from investors looking for a lucrative place to park their money.
Formerly, Gold was the asset investors turned to in times of high inflation because it preserved its value, and whilst investors will often still buy Gold for its safe-haven properties in times of extreme market turmoil, this is not the case most of the time. This is because when inflation is high, central banks will put up interest rates to combat it.
Higher interest rates are negative for Gold because they increase the opportunity-cost of holding Gold vis-a-vis an interest-bearing asset or placing the money in a cash deposit account. On the flipside, lower inflation tends to be positive for Gold as it brings interest rates down, making the bright metal a more viable investment alternative.
Information on these pages contains forward-looking statements that involve risks and uncertainties. Markets and instruments profiled on this page are for informational purposes only and should not in any way come across as a recommendation to buy or sell in these assets. You should do your own thorough research before making any investment decisions. FXStreet does not in any way guarantee that this information is free from mistakes, errors, or material misstatements. It also does not guarantee that this information is of a timely nature. Investing in Open Markets involves a great deal of risk, including the loss of all or a portion of your investment, as well as emotional distress. All risks, losses and costs associated with investing, including total loss of principal, are your responsibility. The views and opinions expressed in this article are those of the authors and do not necessarily reflect the official policy or position of FXStreet nor its advertisers. The author will not be held responsible for information that is found at the end of links posted on this page.
If not otherwise explicitly mentioned in the body of the article, at the time of writing, the author has no position in any stock mentioned in this article and no business relationship with any company mentioned. The author has not received compensation for writing this article, other than from FXStreet.
FXStreet and the author do not provide personalized recommendations. The author makes no representations as to the accuracy, completeness, or suitability of this information. FXStreet and the author will not be liable for any errors, omissions or any losses, injuries or damages arising from this information and its display or use. Errors and omissions excepted.
The author and FXStreet are not registered investment advisors and nothing in this article is intended to be investment advice.
>>> Read full article>>>
Copyright for syndicated content belongs to the linked Source : FXStreet – https://www.fxstreet.com/news/australian-dollar-exhibits-sideways-movement-with-a-positive-bias-despite-a-lower-asx-200-202403110206