The Arbitrum (ARB) price has increased since reaching a new all-time low price on September 11.
The increase has been contained inside a corrective pattern. The price action and RSI are not in alignment, making it difficult to determine the future trend’s direction.
Arbitrum Price Bounces After All-Time Low
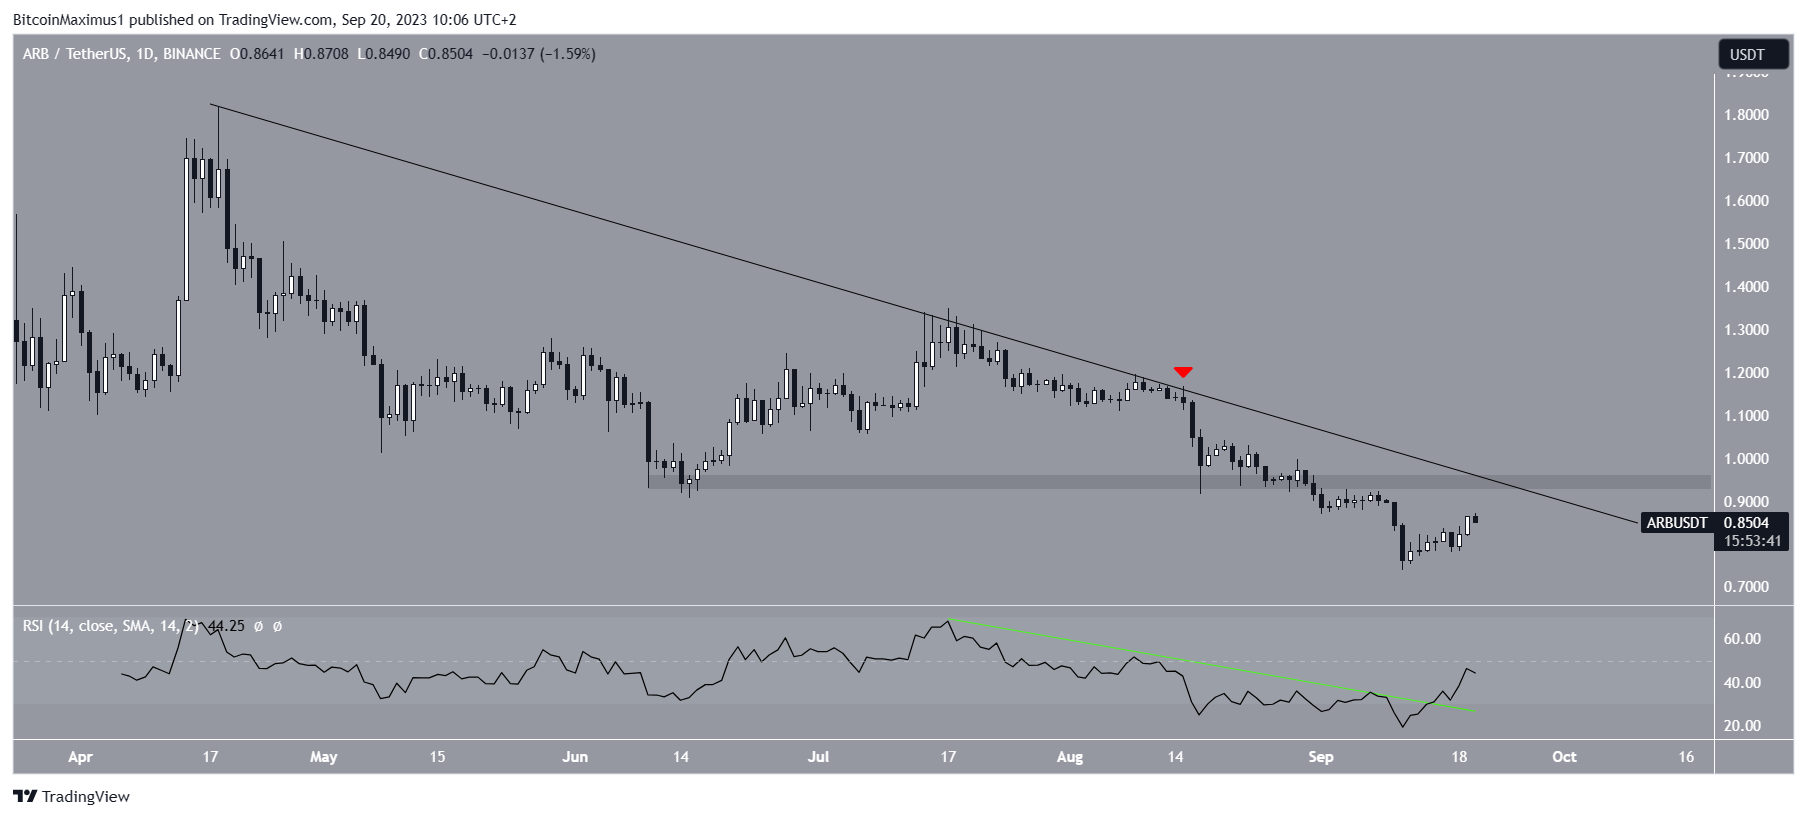
The ARB price has decreased since April 18, when it reached an all-time high price of $1.82. The decrease has been contained under a descending resistance line.
More recently, the line caused a rejection on Aug. 15 (red icon). This accelerated the decrease and led to a new all-time low price of $0.74 on September 11. The downward movement also caused a breakdown from the $0.95 horizontal support area.
While the price of the cryptocurrency has increased since. It still trades below the $0.95 horizontal resistance area and the descending resistance line. The resistances will coincide at the beginning of October.
 ARB/USDT Daily Chart. Source: TradingView
The daily RSI is leaning bullish. Market traders use the RSI as a momentum indicator to identify overbought or oversold conditions and to decide whether to accumulate or sell an asset.
Readings above 50 and an upward trend indicate that bulls still have an advantage, whereas readings below 50 suggest the opposite.
On one hand, the RSI is below 50. Conversely, it is increasing and has broken out from a descending resistance line (green line).
As a result, the daily price action and RSI are not in alignment since one is bearish while the other is leaning bullish.
Will Arbitrum Price Reach $0.95?
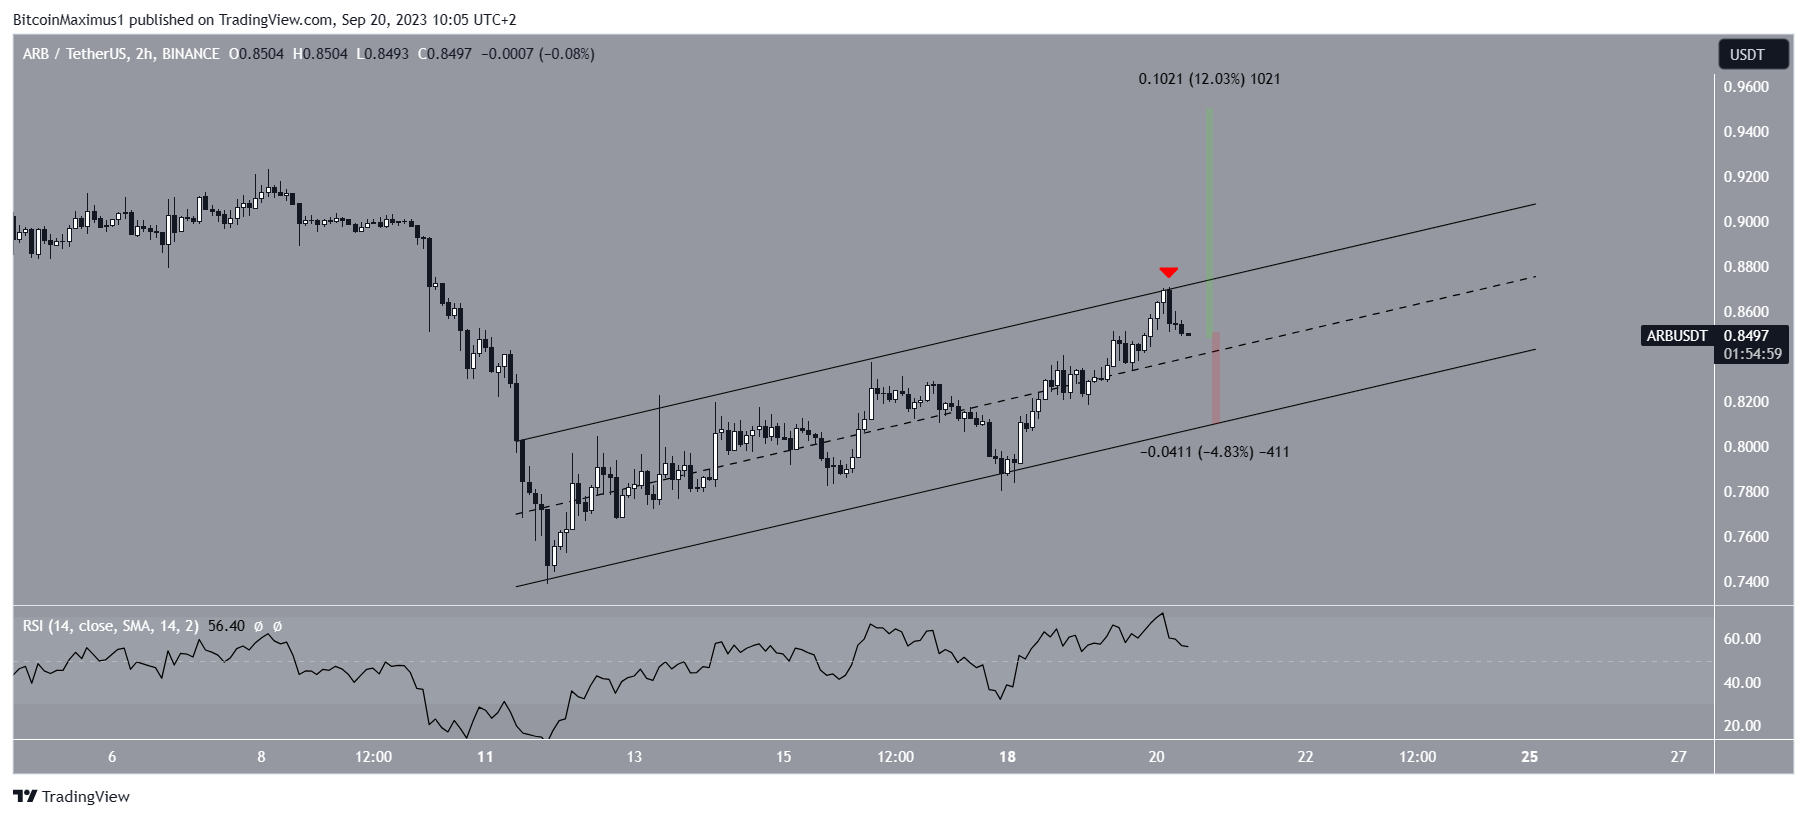
The short-term two-hour timeframe provides a mixed reading. Similarly to the daily timeframe, this comes from conflicting outlooks from the price action and the RSI.
The price action shows that the entire Arbitrum price bounce has been contained inside an ascending parallel channel since the all-time low. These channels usually contain corrective movements, meaning that an eventual breakdown from it would be the most likely future price scenario. The ARB price reached the resistance line on Sept. 20 and has fallen slightly. However, it still trades in the channel’s upper portion.
However, the RSI is bullish. The indicator is increasing and is above 50, both signs of a bullish trend.
 ARB/USDT Two-Hour Chart. Source: TradingView
Therefore, whether a breakout from the channel or rejection occurs will determine the ARB price prediction. A breakout can lead to a 12% increase to $0.95, while a rejection can cause a fall to the channel’s support line at $0.81. This would amount to a drop of 5%.
For BeInCrypto’s latest crypto market analysis, click here.
Disclaimer
In line with the Trust Project guidelines, this price analysis article is for informational purposes only and should not be considered financial or investment advice. BeInCrypto is committed to accurate, unbiased reporting, but market conditions are subject to change without notice. Always conduct your own research and consult with a professional before making any financial decisions.
>>> Read full article>>>
Copyright for syndicated content belongs to the linked Source : BeingCrypto – https://beincrypto.com/arbitrum-price-bounces-after-all-time-low/


