

Gold recovers on Thursday after the release of lower-than-expected Us factory-gate price inflation.
The precious metal had retreated after the Federal Reserve’s more-sober-than-expected policy assessment.
Gold spiked on Wednesday following cooler US inflation data on Wednesday, however, it pulled back after the Fed meeting.
XAU/USD might have formed a bearish Head-and-Shoulders pattern on the daily chart.
Gold (XAU/USD) trades higher and is currently exchanging hands in the $2,320s on Thursday, following some volatile moves. The yellow metal remains broadly stuck in the range between $2,270 and $2,450, the parameters of which were pegged out in April and early May.
Gold has recovered after a weak start, following the release of US Producer Price Index (PPI) data for May. The data showed a 0.2% decline in producer prices month-over-month, according to the US Bureau of Labor Statistics. This came after a 0.5% (revised) rise recorded in April, and was below the 0.2% consensus estimate.
The PPI data, informally known as “factor gate price” inflation, suggests the Federal Reserve (Fed) could move to cut interest rates sooner than previously thought. This is likely to support Gold by reducing the opportunity cost of holding the precious metal, making it more attractive to investors.
Gold has steadied after its spike higher on Wednesday due to the release of less-inflationary US data, which recalibrated near-term interest-rate expectations lower, benefiting Gold.
A more sober assessment by the US Federal Reserve (Fed) after their meeting later on Wednesday, however, stopped bulls in their tracks, after Fed Chair Jerome Powell advocated a cautious data-dependent approach to interest rates going forward.
Gold volatile on snap revisions to interest-rate outlook
Gold shot higher in the minutes following the release of US Consumer Price Index (CPI) data for May on Wednesday.
Headline CPI showed prices steadied month-over-month in May from the 0.3% increase in April, and edged up by 3.3% year-over-year compared to 3.4% previously. The readings were below economists’s expectations of 0.1% MoM and 3.4% YoY.
CPI ex Food & Energy showed prices rose 0.2% MoM from 0.3% in April and 3.4% YoY from 3.6% previously. This was also below expectations of 0.3% and 3.5%, respectively.
The cooler-than-expected CPI data led to a sell-off in the US Dollar (USD) which is negatively correlated to Gold.
Gold price itself rose over half a percent to a peak of $2,342 after the release. The data provided a counterweight to US Nonfarm Payrolls (NFP) data on Friday, which reflected a buoyant labor market and rising wages in the US. These were expected to put upside pressure on inflation.
Fed pours cold water on rate cut hopes
Market optimism at the possibility of lower interest rates, however, was quickly curtailed by a more sober assessment from those that are responsible for setting interest rates, the officials of the US Federal Reserve.
The Fed did not see fit to alter interest rates at their June meeting on Wednesday, as expected. However, they did radically dial down projections of future rate cuts in their attached Summary of Economic Projections (SEP), or dot-plot. This showed Fed officials now on average project only one 0.25% reduction in 2024, compared to three 0.25% cuts in the previous March SEP.
“The revised Summary of Economic Projections, the so called dot-plot published alongside the policy statement, showed that 4 of 19 officials saw no rate cuts in 2024, 7 projected a 25 basis points (bps) rate reduction, while 8 marked down a 50 bps cut in the policy rate,” says Eren Sengezer, Lead Analyst at FXStreet.
Gold retreated on the news, pulling back down to close the day at $2,325.
Technical Analysis: Gold potentially forming Head-and-Shoulders
Gold is potentially forming a bearish Head-and-Shoulders (H&S) price pattern. These patterns generally occur at market tops and signal a change of trend. If the H&S is valid it may be an indication that the medium-term bull trend is reversing.
XAU/USD Daily Chart

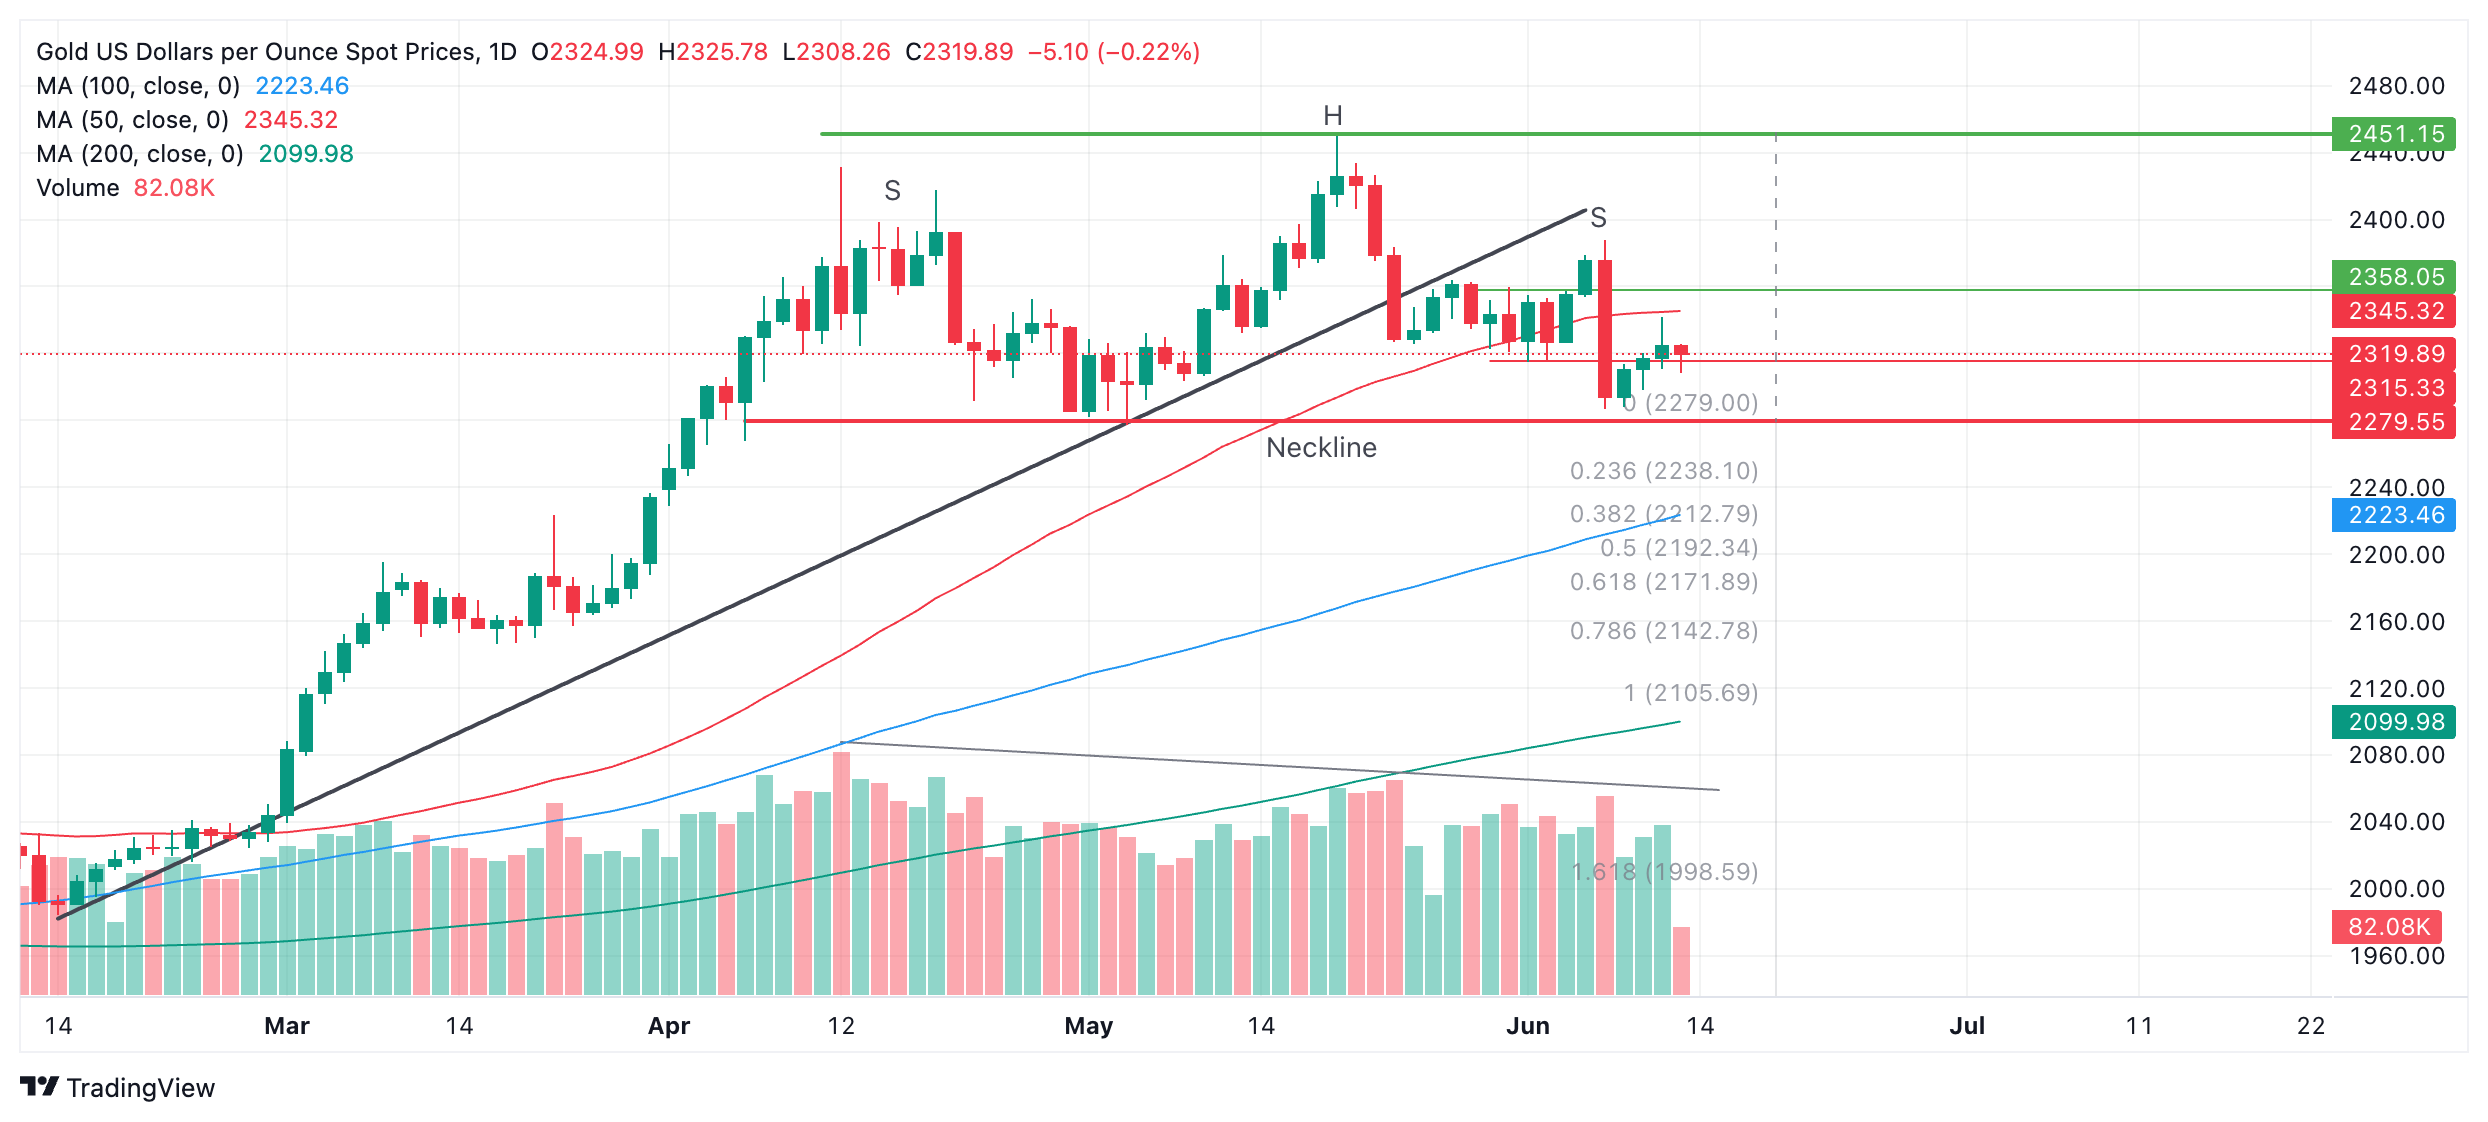
The H&S pattern began forming in April and has now completed a left and right shoulder (labeled “S”) and a “head” (labeled “H”). The so-called “neckline” of the pattern appears to be at the $2,279 support level (red line).
Declining trade volume during its development corroborates the pattern.
A decisive break below the neckline would validate the H&S pattern and activate downside targets. The first, more conservative, target would be $2,171, calculated by taking the 0.618 Fibonacci ratio of the height of the pattern and extrapolating it lower from the neckline. The second target would be at $2,106, the full height of the pattern extrapolated lower.
A break above $2,345, however, would bring the H&S into doubt and could signal a continuation higher, to an initial target at the $2,450 peak.
Gold FAQs
Gold has played a key role in human’s history as it has been widely used as a store of value and medium of exchange. Currently, apart from its shine and usage for jewelry, the precious metal is widely seen as a safe-haven asset, meaning that it is considered a good investment during turbulent times. Gold is also widely seen as a hedge against inflation and against depreciating currencies as it doesn’t rely on any specific issuer or government.
Central banks are the biggest Gold holders. In their aim to support their currencies in turbulent times, central banks tend to diversify their reserves and buy Gold to improve the perceived strength of the economy and the currency. High Gold reserves can be a source of trust for a country’s solvency. Central banks added 1,136 tonnes of Gold worth around $70 billion to their reserves in 2022, according to data from the World Gold Council. This is the highest yearly purchase since records began. Central banks from emerging economies such as China, India and Turkey are quickly increasing their Gold reserves.
Gold has an inverse correlation with the US Dollar and US Treasuries, which are both major reserve and safe-haven assets. When the Dollar depreciates, Gold tends to rise, enabling investors and central banks to diversify their assets in turbulent times. Gold is also inversely correlated with risk assets. A rally in the stock market tends to weaken Gold price, while sell-offs in riskier markets tend to favor the precious metal.
The price can move due to a wide range of factors. Geopolitical instability or fears of a deep recession can quickly make Gold price escalate due to its safe-haven status. As a yield-less asset, Gold tends to rise with lower interest rates, while higher cost of money usually weighs down on the yellow metal. Still, most moves depend on how the US Dollar (USD) behaves as the asset is priced in dollars (XAU/USD). A strong Dollar tends to keep the price of Gold controlled, whereas a weaker Dollar is likely to push Gold prices up.
Information on these pages contains forward-looking statements that involve risks and uncertainties. Markets and instruments profiled on this page are for informational purposes only and should not in any way come across as a recommendation to buy or sell in these assets. You should do your own thorough research before making any investment decisions. FXStreet does not in any way guarantee that this information is free from mistakes, errors, or material misstatements. It also does not guarantee that this information is of a timely nature. Investing in Open Markets involves a great deal of risk, including the loss of all or a portion of your investment, as well as emotional distress. All risks, losses and costs associated with investing, including total loss of principal, are your responsibility. The views and opinions expressed in this article are those of the authors and do not necessarily reflect the official policy or position of FXStreet nor its advertisers. The author will not be held responsible for information that is found at the end of links posted on this page.
If not otherwise explicitly mentioned in the body of the article, at the time of writing, the author has no position in any stock mentioned in this article and no business relationship with any company mentioned. The author has not received compensation for writing this article, other than from FXStreet.
FXStreet and the author do not provide personalized recommendations. The author makes no representations as to the accuracy, completeness, or suitability of this information. FXStreet and the author will not be liable for any errors, omissions or any losses, injuries or damages arising from this information and its display or use. Errors and omissions excepted.
The author and FXStreet are not registered investment advisors and nothing in this article is intended to be investment advice.
>>> Read full article>>>
Copyright for syndicated content belongs to the linked Source : FXStreet – https://www.fxstreet.com/news/gold-retreats-slightly-as-fed-puts-breaks-on-quick-easing-cycle-202406131145