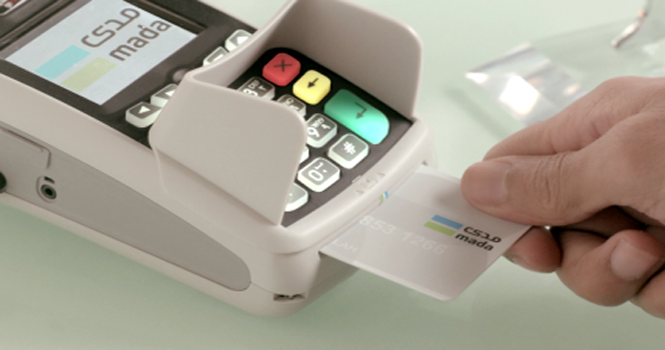
POS device
Point-of-sale (POS) transactions in Saudi Arabia totaled approximately SAR 12.52 billion in the week ended May 11, down from nearly SAR 14.47 billion in the previous week.
For more POS data on Argaam Tools
The number of POS transactions reached about 204.1 million last week, according to data issued by SAMA.
POS transactions represent consumer expenditures through debit and credit cards at major shopping centers, retail outlets, pharmacies, and others.
Weekly POS Transactions
Week
Number of Transactions
(,000)
Value of Transactions
(SAR mln)
Change in Value
May 7- May 13
171464
10890.2
(6%)
May 14- May 20
160857
10092.0
(7%)
May 21- May 27
163445
10705.0
+6%
May 28- June 3
188590
13815.2
+29%
June 4- June 10
173918
11686.9
(15%)
June 11- June 17
175694
11651.8
(0.3%)
June 18- June 24
171662
12295.7
+6%
June 25- July 1
177776
12123.1
(1%)
July 2 – July 8
166489
11189.6
(8%)
July 9 – July 15
171246
10919.2
(2%)
July 16 – July 22
159618
10120.9
(7%)
July 23 – July 29
173387
11917.3
+18%
July 30 – Aug. 5
183645
12664.7
+6%
Aug. 6 – Aug. 12
178956
11969.1
(5%)
Aug. 13 – Aug. 19
172775
12020.6
+0.4%
Aug. 20 – Aug. 26
166097
11367.7
(5%)
Aug. 27 – Sept. 2
195602
13836.3
+22%
Sept. 3 – Sept. 9
180155
11326.9
(18%)
Sept. 10 – Sept. 16
181876
11186.1
(1%)
Sept. 17 – Sept. 23
173910
10869.2
(3%)
Sept. 24 – Sept. 30
191142
13624.6
+25%
Oct. 1 – Oct. 7
189423
12145.5
(11%)
Sept. 8 – Oct. 14
183772
11146.7
(8%)
Oct. 15 – Oct. 21
169962
10056.6
(10%)
Oct. 22 – Oct. 28
186331
12301.9
+22%
Oct. 29 – Nov. 4
193290
12779.8
+4%
Nov. 5 – Nov. 11
185865
11500.1
(10%)
Nov. 12 – Nov. 18
180221
11271.4
(2%)
Nov. 19 – Nov. 25
171930
11247.8
(0.2%)
Nov. 26 – Dec. 2
204688
14874.1
+32%
Dec. 3 – Dec. 9
187765
12067.1
(19%)
Dec. 10 – Dec. 16
186657
11637.5
(4%)
Dec. 17 – Dec. 23
171770
10701.7
(8%)
Dec. 24 – Dec. 30
198191
13989.3
+31%
Dec. 31 -Jan. 6
198013
13393.8
(4%)
Jan. 7-Jan.13
191673
12347.1
(8%)
January 14-Jan. 20
172823
10607.7
(14%)
Jan. 21-Jan. 27
178011
11039.9
+4%
Jan. 28-Feb. 3
204897
14327.4
+30%
Feb. 4-Feb. 10
188307
11873.1
(17%)
Feb. 11-Feb. 17
191200
11965.4
+1%
Feb. 18-Feb. 24
186346
12137.9
+1%
Feb. 25-March 2
212770
16209.2
+34%
March 3-March 9
206227
14768.8
(9%)
March 10-March 16
168615
11688.2
(21%)
March 17-March 23
160246
11461.0
(2%)
March 24-March 30
174062
14028.5
+22%
March 31-April 6
203174
16537.9
+18%
April 7-April 13
179221
11351.3
(31%)
April 14-April 20
171037
10138.8
(11%)
April 21-April 27
181035
10851.6
+7%
April 28-May 4
214543
14473.5
+33%
May 4-May 11
204102
12522.3
(13%)
Sales value declined in all sectors last week, led by the telecommunications sector with a 21% weekly increase, followed by the food & beverages sector and the hotels sectors with 19% each.
Consumer spending was focused on the F&B sector, totaling SAR 1.96 billion during the week. The restaurants and cafes sector followed with total POS transactions worth SAR 1.82 billion, as follows:
POS Transactions by Sector (SAR mln)
Sector
Value of Transactions in Week Ended May 4
Value of Transactions in Week Ended May 11
Weekly Change
Telecommunications
134.3
105.6
(21%)
Food & Beverages
2421.6
1956.4
(19%)
Hotels
324.9
264.6
(19%)
Recreation & Culture
293.5
249.7
(15%)
Clothes & Footwear
814.4
695.3
(15%)
Miscellaneous Goods & Services
1803.9
1551.1
(14%)
Restaurants and Cafes
2090.5
1824.3
(13%)
Healthcare
945.9
831.0
(12%)
Transport
812.0
723.5
(11%)
Electronics and Electric Appliances
251.7
226.5
(10%)
Public Utilities
91.3
82.2
(10%)
Furniture
306.7
277.7
(9%)
Jewelry
278.5
252.5
(9%)
Fuel Stations
972.5
889.5
(9%)
Education
206.4
198.3
(4%)
Construction Materials
344.7
341.4
(1%)
Others
2380.9
2052.8
(14%)
Total
14473.5
12522.3
(13%)
Riyadh led in terms of POS value during the week with approximately SAR 4.27 billion, representing 34.07% of the total. Jeddah came in second with SAR 1.76 billion, as follows:
POS Transactions by City (SAR mln)
City
Value of Transactions in Week Ended May 4
Value of Transactions in Week Ended May 11
Weekly Change
Riyad
4714.3
4266.1
(10%)
Jeddah
1979.6
1762.9
(11%)
Dammam
677.3
639.1
(6%)
Madinah
551.0
462.7
(16%)
Makkah
545.3
462.0
(15%)
Al Khobar
393.2
371.8
(5%)
Buraidah
328.7
286.5
(13%)
Tabuk
314.4
246.3
(22%)
Hail
253.1
196.5
(22%)
Abha
197.4
160.0
(19%)
Other cities
4519.2
3668.2
(19%)
Total
14473.5
12522.3
(13%)
>>> Read full article>>>
Copyright for syndicated content belongs to the linked Source : Argaam EN – https://www.argaam.com/en/article/articledetail/id/1729079


