
Main
Intravital imaging1,2,3,4,5,6,7 is vital for studying diverse physiopathological processes, such as brain functions and immune responses, which necessitates high spatiotemporal resolution, high fidelity and low phototoxicity to capture fine structures and transient three-dimensional (3D) dynamics non-invasively8,9,10,11,12,13. An essential difference between in vitro and in vivo imaging is the presence of intense background fluorescence originating from out-of-focus signals and autofluorescence in scattered tissue or densely labeled samples, which poses a fundamental constraint on the imaging fidelity14,15,16. Confocal microscopy17,18,19 is the most widely used technique to address this problem with optical sectioning. By rejecting the out-of-focus fluorescence with a pinhole, slit or pinhole array, only the in-focus photons within a very shallow depth of field (DOF) are captured, leading to high signal-to-background ratio (SBR) in intravital imaging. However, these confocal approaches inevitably reduce system parallelization indicated by the effective data throughput per unit of time and result in strong phototoxicity due to repeated excitation of out-of-focus layers and intense laser illumination during 3D imaging. In contrast, light-field microscopy (LFM)20,21,22,23,24,25,26,27,28,29 maximizes the parallelization with low phototoxicity by exciting and imaging the entire volume within an extended DOF. By incorporating line-confocal illumination, confocal light-field microscopy (cLFM)30 not only can detect 3D photons in a parallel way but also suppress the background fluorescence out of the effective axial range. However, its Fourier LFM configuration fundamentally reduces the spatial resolution due to the loss of high-frequency information during pupil segmentation, restricting the application in observing subcellular dynamics. Recently, we proposed scanning LFM (sLFM)31 to increase the resolution up to the diffraction limit while maintaining the low phototoxicity by placing a drifting coded microlens array (MLA) at the image plane31,32. Although sLFM enables high-speed multi-site aberration correction with digital adaptive optics to maintain subcellular resolution in multi-cellular organisms, it still faces severe degradation with the existence of strong background fluorescence.
To address this problem, we propose confocal scanning LFM (csLFM) to achieve aberration-corrected high-speed 3D subcellular imaging with both optical sectioning and low phototoxicity by developing a line-confocal scheme upon our sLFM31. With direct synchronization of an axially elongated line-confocal illumination and the camera rolling shutter of multiple rows, csLFM can selectively collect fluorescent signals from in-focus volume within a compact system. Compared to sLFM, csLFM achieves 15-fold improvement in SBR for high-fidelity imaging of densely labeled samples while maintaining the same effective axial coverage, near-diffraction-limit resolution in complicated environments and two orders-of-magnitude reduction in photobleaching over spinning-disk confocal microscopy (SDCM). We constructed both inverted and upright csLFM systems to demonstrate their applications in diverse species, including zebrafish, Drosophila and mouse. Although large-scale 3D neural recording is one of the key applications of LFM, our results show that the crosstalk from background fluorescence severely degrades the fidelity of calcium responses at the single-cell level, leading to reduced orientation selectivity to visual stimuli. csLFM effectively removes the crosstalk and achieves similar performance to two-photon microscopy but with lower excitation power even below 1 mW mm−2 and much higher data throughput. Moreover, various subcellular dynamics are observed by csLFM in previously challenging environments, such as migrasome delivery in mouse spleen, retractosome generation in mouse liver and 3D voltage imaging at subcellular resolution in Drosophila with dense labeling, demonstrating its broad applications in the intravital study of large-scale intercellular interactions.
Results
Principle of csLFM
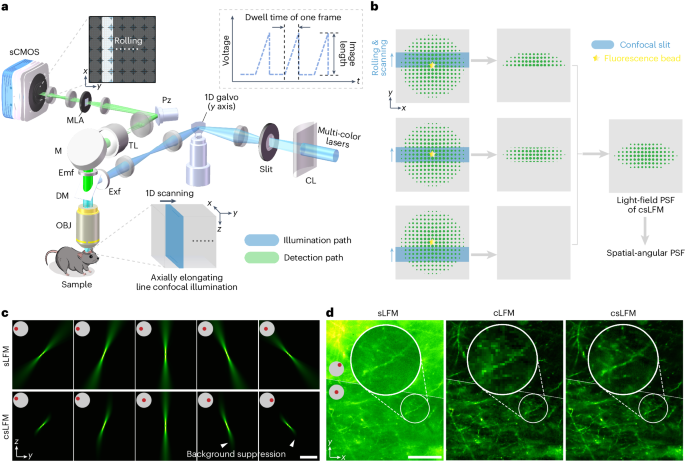
To achieve both imaging parallelization and optical sectioning, we designed an elongated line-confocal illumination33,34,35 based on sLFM31. The camera rolling shutter is synchronized with the scanning illumination at high speed as the confocal slit to filter out background fluorescence without sacrificing the imaging speed in a compact system (Fig. 1a and Supplementary Fig. 1). To facilitate confocality, we set the slit size the same as the height of rolling shutter. The accurate synchronization contributes to a moving mask on light-field images followed by an integration process during exposure, which modulates the point spread functions (PSFs) at camera frame rate (Fig. 1b, Supplementary Fig. 2 and Methods). The MLA is placed at the imaging plane for light-field detection, along with a piezoelectric tip and tilt platform for high-speed periodic drifting to address the tradeoff between spatial resolution and angular resolution in LFM31 (Supplementary Video 1). After data acquisition, iterative tomography with digital adaptive optics31 same as previous sLFM can be applied for aberration-corrected 3D reconstruction with the modified confocal PSF. By keeping the photons focused within an extended DOF, csLFM provides an efficient way for 3D sensing with elongated PSFs along different angles (Fig. 1c). Therefore, the design of silt size entails a holistic assessment of the photon efficiency, axial coverage and background rejection performance. Only photons falling beyond the effective volume range need to be eliminated, which is different from traditional confocal microscopy requiring a small pinhole size for a shallow DOF. When we reduce the slit size together with the height of rolling shutter, csLFM will first maintain the same DOF and then gradually lose its effective axial coverage (Supplementary Fig. 3a–g). If we do not consider confocal illumination in PSF modeling, there will be artifacts at the out-of-focus planes during 3D reconstruction, especially for small slit sizes (Supplementary Fig. 3h,i). On the contrary, increasing the slit size will loosen the confocal constraint, degrading the capability of background rejection as indicated by the numerical simulations (Supplementary Fig. 4a–g). Similar optical sectioning can be obtained when the slit size is smaller than 11-times Airy units (AU) of the whole-objective numerical aperture (NA). Consequently, to maximize the 3D photon efficiency for low phototoxicity while maintaining the high SBR, we set the slit size as 11 AU for the angular resolution of 13 × 13 in csLFM, corresponding to the 13 × 13 sensor pixels after each microlens (Supplementary Fig. 4h,i). The axial coverage remains almost unchanged relative to sLFM with an effective DOF of 15 μm for 1.4-NA objective and similar optical sectioning capability compared to the silt size of 1 AU (Supplementary Figs. 3c–f and 4g).
Fig. 1: Schematic of csLFM.
a, Diagram of csLFM system where an elongated line illumination is synchronized with the camera rolling shutter in the detection path. A cylindrical lens and an optical slit are used to converge the beam into an axially elongated line-confocal illumination with a galvo for lateral scanning. The piezoelectric tip/tilt platform and an MLA is used for scanning light-field imaging for the measurement of high-resolution spatial-angular components. CL, cylindrical lens; DM, dichroic mirror; Emf, emission filter; Exf, excitation filter; M, mirror; OBJ, objective; Pz, piezoelectric tip and tilt platform; sCMOS, scientific complementary metal-oxide semiconductor; TL, tube lens. b, Illustration of the confocal modulation on sLFM detection. The axially elongated line-confocal illumination is scanned to excite the fluorescence bead in the center of the FOV, with the rolling shutter synchronously reading out the active pixels, collecting emitted fluorescent photons from only in-focus regions. c, Comparisons of PSFs between sLFM and csLFM from several angles, with insets indicating corresponding sub-aperture. d, The raw measurements on a thick brain slice after pixel realignment for the comparison among sLFM, cLFM and csLFM. Two angles are visualized. Scale bars, 10 μm (c) and 50 μm (d).
By changing different background levels in numerical simulation, csLFM quantitatively achieved 12-dB improvement in SBR over sLFM (Supplementary Fig. 5). Although our previous study of computational background suppression36 can alleviate background contamination to some extent, the background fluorescence cannot be eliminated and will further reduce the axial resolution with the existence of strong background fluorescence (Supplementary Fig. 6). More importantly, the shot noise is positively correlated with the measured intensity, so it is difficult to be removed computationally. By physically rejecting the background fluorescence, csLFM can effectively increase the signal-to-noise ratio (SNR) to distinguish minute structures with subcellular resolution (Fig. 1d and Supplementary Fig. 7). One of the key advantages of sLFM is multi-site aberration correction with digital adaptive optics. Spatially non-uniform aberrations can be estimated based on the local disparities between different angular components and then corrected during 3D reconstruction with an accurate PSF model. However, strong background fluorescence will deteriorate the accuracy of wavefront estimation, leading to severe artifacts and reduced resolution (Supplementary Fig. 8). csLFM can address this problem because it effectively extracts signals from the background. Another challenge arises from the highly dynamic samples, leading to motion artifacts during physical scanning. Both time-weighted algorithm31 or optical-flow-based correction32 are also applicable to csLFM to eliminate the motion artifacts while maintaining high spatial resolution (Supplementary Fig. 9).
Experimental characterization and analysis
For experimental validations, we compared csLFM with sLFM31 and cLFM30 on the same system (Methods) and state-of-the-art intravital microscopy, such as SDCM and two-photon microscopy. We implemented cLFM30 here with line-confocal illumination without two-dimensional (2D) periodic scanning. First, we evaluated the background rejection capability by imaging 500-nm-diameter fluorescence beads randomly distributed in a 3D tissue-mimicking phantom made of intralipid and agarose by different methods (Fig. 2a). Background fluorescence gradually overwhelmed the intensity of in-focus beads as the penetration depth increases, which degraded the imaging performance and limited the depth of sLFM (Supplementary Fig. 10a–c). Under different concentrations of intralipid, csLFM obtained an overall 12-dB improvement in terms of SBR with deeper penetration depth and about three-fold narrower lateral full width at half maximum (FWHM) profile along beads in raw measurements than sLFM (Fig. 2b). When compared to traditional slit confocal microscopy, csLFM captures four-dimensional (4D) spatial-angular measurements with an extended DOF along multiple angular PSFs. Therefore, the background fluorescence in the other orthogonal direction can still be distinguished based on the disparities between different angular views, achieving computational rejection of background fluorescence36. The statistical plots indicate that csLFM can achieve similar performance to SDCM (Andor Dragonfly 200) in terms of SBR (Fig. 2c and Supplementary Fig. 10d). Similar results can be obtained when we used an upright system to image vascular structures in the brain of an awake wild-type mouse injected with AF647 dye. By increasing the SBR, csLFM increased penetration depth from 140 μm to 280 μm in mouse cortex with more uniform resolution performance than sLFM (Supplementary Fig. 11).
Fig. 2: Experimental characterization of csLFM on SBR, resolution and phototoxicity.

a, Center-view measurements and enlarged regions of mixture of 0.0005% 0.5-μm fluorescence beads, 1% intralipid and 1% agarose by sLFM and csLFM at the depth of 0 μm. b, Normalized intensity profiles along two beads. c, Curves of SBR versus different depths for sLFM, csLFM and SDCM. Data are represented as mean ± s.d. Twelve typical beads in each depth were involved. d, MIPs of dendritic cells and T cells in mouse spleens, acquired by sLFM, cLFM and csLFM. Insets show Fourier transforms with estimated resolutions by FRC. e, Box plot showing SBR comparisons between sLFM and csLFM. The box plot format: center line, median; box limits, lower and upper quartiles; and whiskers, 0th–100th percentiles excluding outliers. P values were calculated by two-sided paired t-test, n = 12 cells. P = 9.62 × 10⁻¹³ for dendritic cells and P = 2.77 × 10⁻¹² for T cells. P 0.8 was used to calculate the percentage. n = 51 neurons for sLFM and n = 106 for csLFM. The results in f–i were obtained from four mice in independent experiments. j, OSI distributions obtained from a two-photon microscope were used as the reference. Scale bars, 100 μm (a,e). MIP, maximum intensity projection.
To verify the advantages, we constructed an upright csLFM system equipped with a ×25/1.05-NA water immersion objective (Supplementary Fig. 18 and Methods) and observed calcium activities at the cortical layer 2/3 in an awake mouse expressing genetically encoded GCaMP6f (Ai148D). To increase the DOF, the slit size was set as 26 AU for higher angular resolution of 21 × 21 in the upright system44. We compared the performance of sLFM and csLFM by imaging the identical region of interest (ROI) at 20 volumes per second (VPS; Supplementary Video 5). The cLFM counterparts were extracted from raw data of csLFM and analyzed. We used the CNMF algorithm45 to extract the calcium traces at single-cell level. Given the relatively large size (~10 μm) of neurons and sparse distribution in mice, the functional traces extracted from cLFM results resembled those obtained with csLFM, yet distinguishing subcellular dendritic structures was difficult for cLFM (Supplementary Fig. 19a). Compared to sLFM, though, csLFM exhibited much more identified spike numbers and higher ΔF/F0 amplitudes with better contrast (Fig. 5b,c). Applying background subtraction to sLFM data moderately improved the spike amplitude; however, it could not identify the sufficient number of neurons and spikes as in csLFM (Supplementary Fig. 19b,c). Some spikes engulfed by the background are difficult to recover.
To further analyze the data fidelity for neuroscience applications, we recorded the calcium dynamics in primary visual cortex under multiple rounds of visual stimuli with a moving grating (Fig. 5d). It is a classical experiment to measure the tuning properties of neurons responding to visual stimulus, which has been widely verified by electrophysiology and two-photon imaging46,47. Except for better contrast in csLFM, we found that the same neurons with a sharp tuning curve in csLFM showed broadened curves in sLFM due to strong background crosstalk (Fig. 5e,f). In addition, many weak responses are flooded in the increased baseline signal in sLFM, which has been well retrieved in csLFM. The inter-class distances of csLFM were larger than those of sLFM during clustering (Fig. 5g,h). We further calculated the orientation selectivity index (OSI) for the neurons (Fig. 5i). Across four mice independently observed by sLFM, only 25% of all visually responsive neurons had orientation tunings larger than 0.8, whereas approximately 52% had OSIs larger than 0.8 in csLFM data on the same mice. The latter OSI distribution was similar to the results obtained by 2D imaging with a two-photon microscope (Fig. 5j and Supplementary Fig. 20), which also accords well with previous studies48.
Because csLFM does not rely on any sample prior, it can be generally applied to diverse species with different indicators. Next, we recorded timelapse calcium transient of the whole brain in a zebrafish larva expressing genetically encoded GCaMP6s (huc:GCaMP6s). The zebrafish brain contains a high density of neuron populations in foreground and background layers with small neuronal size, requiring high resolution to identify single cells clearly. After improving spatial resolution and rejecting out-of-focus light, more neurons were identified with better resolution and higher fidelity in csLFM than in cLFM and sLFM (Fig. 6a–d and Supplementary Video 6). Similarly, we imaged a craniotomized Drosophila expressing genetically encoded GCaMP7f (nsyb-Gal4×UAS-jGCaMP7f) in vivo at 60 VPS. The Drosophila brain is very different from mammalian and zebrafish brains in morphology, and its dense labeling leads to an intense background and low resolution, which is ameliorated by csLFM (Fig. 6e). We gave the Drosophila multiple rounds of odor stimuli, to motivate the calcium responses. Approximately two-fold increase in spike amplitude was observed, thereby verifying the effectiveness of csLFM (Fig. 6f,g).
Fig. 6: csLFM can be applied in diverse species and indicators with better fidelity.

a, Comparison among sLFM, cLFM and csLFM in a zebrafish larva labeled with GCaMP6s at 20 VPS. Displayed images are MIPs of STD volumes over time. b, Bar chart of detected neuron number. n = 3 independent experiments. P = 2.39 × 10⁻³ between sLFM and csLFM and P = 2.43 × 10⁻³ between cLFM and csLFM. Data are represented as means ± s.d. c, Box plot showing SBR comparison. SBR was calculated on the s.d. image where each neuron represents a signal. n represents identified neuron number. n = 66 for sLFM, n = 86 for cLFM and n = 158 for csLFM. P = 5.36 × 10⁻⁷ between sLFM and csLFM and P = 1.8 9× 10⁻⁸ between cLFM and csLFM. d, Temporal traces extracted from a with zoom-in panels. e, Comparison among different methods in a Drosophila brain labeled with GCaMP7f at 60 VPS. Displayed images are MIPs of the average volumes over time. f, Temporal traces extracted from manually selected regions in g, with colors implying odor stimuli. Arrows point to spikes almost swamped by sLFM but clearly identified by csLFM. g, Box plot showing spike amplitude comparison. n = 48 identified spikes and P = 4.03 × 10⁻²². h, Comparison of dopamine neurons at a depth of approximately 100 μm in Drosophila brain (TH-Gal4×UAS-pAce) expressing voltage signals, imaged by sLFM and csLFM at 150 VPS. Displayed images are MIPs of the average volumes over time. i, Temporal traces extracted from manually selected regions in h, with black circles marking the spikes. j, Bar chart of detected spike number by different methods. n = 3 independent experiments. P = 9.98 × 10⁻³. Data are represented as means ± s.d. k, Histogram showing spike amplitude. n represents identified spike number. n = 53 for sLFM and n = 143 for csLFM. Format of all box plots: center line, median; box limits, lower and upper quartiles; and whiskers, 0th–100th percentiles excluding outliers. P values were all calculated by two-sided paired t-test, and P UAS-pAce) labeled with voltage indicators in all dopaminergic neurons and (nsyb-gal4×UAS-jGCaMP7f) labeled with calcium indicators in all neurons were provided by the Schnitzer laboratory at Stanford University and the Zhong laboratory at Tsinghua University. Flies were raised on standard cornmeal medium with a 12-h light/dark cycle at 23 °C and 60% humidity and housed in mixed male/female vials. Three- to eight-day-old female flies were selected for brain imaging. To prepare for imaging, flies were anesthetized on ice and mounted in a 3D-printed plastic disk with free movement of the legs. Then, the posterior head capsules were opened using sharp forceps (Dumont, 5SF) at room temperature in fresh saline (103 mM NaCl, 3 mM KCl, 5 mM TES, 1.5 mM CaCl2, 4 mM MgCl2, 26 mM NaHCO3, 1 mM NaH2PO4, 8 mM trehalose and 10 mM glucose (pH 7.2), bubbled with 95% O2 and 50% CO2). The fat body and air sac were also removed carefully. Next, to minimize brain movement63, UV glue was also added around the proboscis, and the M16 muscle was removed. After the surgery, the Drosophila were placed under the objective lens for imaging.
Neural activity extraction
For calcium analysis in Figs. 5 and 6, we used the CNMF algorithm45 to obtain neuron segmentations and temporal traces for the mouse and zebrafish data, and we manually selected several ROIs as labeled to obtain temporal traces for the Drosophila data. The temporal traces were calculated by ΔF/F0 = (F − F0) / F0, where F0 is the mean fluorescence in the ROI averaged over the entire time series, and F is the averaged intensity of the ROI. The neural spikes were identified as the local peaks that surpassed a threshold value (40%). The amplitude of each spike was calculated as the absolute value of its peak value. The orientation-selective response (polar plots) of each trace was calculated by averaging ΔF/F0 during the stimuli for different orientations. For neuronal orientation selectivity analysis, neurons with high visual response (R > 3) were considered, where R was defined as the ratio of the average ΔF/F0 with stimuli to the average ΔF/F0 without stimuli. The OSI was calculated as (Rpref − Rorth) / (Rpref + Rorth)64, where Rpref is the maximum orientation-selective response, and Rorth is the mean response with the orientations orthogonal to the Rpref. For the t-distributed stochastic neighbor embedding (t-SNE) analysis, we used the MATLAB built-in ‘tsne.m’ function.
For voltage analysis in Fig. 6h–k, we manually selected several ROIs as labeled and obtained ΔF/F0 temporal traces followed by a wavelet-based denoising. The neural spikes were identified as the local peaks that surpassed a threshold value (2%) after the ΔF/F0 curve subtracts its median-filtered (130-ms window) version and were visualized by the shining color in Supplementary Video 7. The amplitude of each spike was calculated as the absolute value of its peak value. The video of subframe voltage propagation was made with quadratic spline interpolation65.
Ethics statement
This work was carried out with all relevant ethical regulations for animal research. All biological experiments were conducted with ethical approval from the Animal Care and Use Committee of Tsinghua University.
Performance metrics
To demonstrate the background reduction by csLFM, we used SBR for metric evaluation. SBR was defined as the 10-fold logarithmic ratio between signal (maximum intensity of selected ROIs) and background (average intensity of regions without signals), as described in the following formula:
$$SBR=10{log }_{10}left(frac{max (are{a}_{S})}{{rm{mean}}(are{a}_{B})}right),$$
where areaS represented the signal region, and areaB represented the background region. When the signal is equal to the background, the SBR is 0 dB. The SNR and structural similarity index measure (SSIM) were used to evaluate the reconstruction performance of csLFM. SNR was calculated as
$$SNR=10{log }_{10}frac{{Vert XVert }_{2}^{2}}{{Vert X-YVert }_{2}^{2}},$$
where X is the ground truth, and Y is the reconstruction result by csLFM. The SSIM was calculated by the following formula:
$$SSIM=frac{left(2{mu }_{X}{mu }_{Y}+{(0.01cdot L)}^{2}right)left(2{sigma }_{XY}+{(0.03cdot L)}^{2}right)}{left({mu }_{X}^{2}+{mu }_{Y}^{2}+{(0.01cdot L)}^{2}right)left({sigma }_{X}^{2}+{sigma }_{Y}^{2}+{(0.03cdot L)}^{2}right)},$$
where μX and μY are average values of ground truth and reconstruction, and σX, σY and σXY are the corresponding standard deviations and covariance. The data were normalized by their maximum value, and L is the maximum value of X. The SSIM indices were calculated on 3D images with 3D local Gaussian kernels.
To evaluate the dispersion between data clusters, we used Calinski–Harabasz score, intra-class distance and inter-class distance for metric evaluation. The Calinski–Harabasz score was calculated by the following formula:
$$s=frac{S{S}_{B}}{S{S}_{W}}cdot frac{N-k}{k-1}=frac{mathop{sum }nolimits_{q=1}^{k}{N}_{q}dleft({{bf{c}}}_{q}-{{bf{c}}}_{E},{{bf{c}}}_{q}-{{bf{c}}}_{E}right)}{mathop{sum }nolimits_{q=1}^{k}mathop{sum }nolimits_{n=1}^{{N}_{q}}dleft({{bf{X}}}_{n}^{(q)}-{{bf{c}}}_{q},{{bf{X}}}_{n}^{(q)}-{{bf{c}}}_{q}right)}cdot frac{N-k}{k-1},$$
where Ωq is the q-th class; SSB is the inter-class variance; SSW is the intra-class variance; N is the total sample size; Nq is the sample size of Ωq; k is the number of classes; ({{bf{X}}}_{n}^{(q)}) is a feature vector of the n-th sample in Ωq; cE is the mean of all samples; cq is the mean of all samples in Ωq; and d(·) is the Euclidean distance between two vectors. The intra-class distance and inter-class distance was calculated, respectively, as
$$dleft({varOmega }_{q},{varOmega }_{q}right)=frac{1}{{N}_{q}^{2}}mathop{sum }limits_{k=1}^{{N}_{q}}mathop{sum }limits_{l=1}^{{N}_{q}}dleft({{bf{X}}}_{k}^{(q)},{{bf{X}}}_{l}^{(q)}right),$$
$$dleft({varOmega }_{q},{varOmega }_{p}right)=frac{1}{{N}_{q}{N}_{p}}mathop{sum }limits_{k=1}^{{N}_{q}}mathop{sum }limits_{l=1}^{{N}_{p}}dleft({{bf{X}}}_{k}^{(q)},{{bf{X}}}_{l}^{(p)}right),$$
The intra-class distances together with inter-class distances formed a distance matrix between classes, as shown in Fig. 5h.
Data analysis
All data processing and analysis were accomplished with customized MATLAB (MathWorks, MATLAB 2019a) scripts. The hardware synchronization was controlled with an NI-USB-6363 box and our customized LabVIEW program. The 3D rendering of the volumes was performed by Imaris (Imaris 9.0.1 software) or Voltex modules in Amira (Thermo Fisher Scientific, Amira 2019). The 3D tracking of immune cells in the spleen was carried out automatically using Imaris. For the analysis of interaction times between NK cells and macrophages, we first conducted tracking and numbering separately for channels of NK cells and macrophages. The NK cells and macrophages were then segmented in each channel. Next, the count of overlapping structures between the two channels was identified as the number of contacting cell pairs. The interaction times at t = t0 were considered as the cumulative values from 0 to t0. If the i-th NK cell and the j-th macrophage both interacted in consecutive two frames, the interaction times would not be cumulated. For the analysis of interaction frequency between NK cells and macrophages, NK cells and macrophages were first segmented in each channel. Then, the overlap between the two channels was calculated as a binary mask at each frame. This binary mask was next applied separately to the segmentations of the two channels, resulting in the respective counts of interacting cells in each channel. The sum of these counts provided the interacting cell number. The total cell number was determined on the segmentations in two channels. The frequency was finally returned as the ratio of the number of cells that made interactions to the total cell number. For the analysis of the number of cell pairs between dendritic cells and T cells, the cells were first segmented in each channel, and then the count of overlapping structures between the two channels was returned as the number of contacting cell pairs. For the analysis of retraction fibers, the detection of fibers generated from immune cells was carried out using the ridge detection plug-in of ImageJ software (version 1.51) automatically. Fiber structures with the width of 0.2–1 μm and the length of more than 3 μm were identified, and invalid results were also sifted out manually. For the analysis of the average fiber number produced by each cell pair, fibers that are not generated in cell contact were eliminated manually.
Reporting summary
Further information on research design is available in the Nature Portfolio Reporting Summary linked to this article.
Data availability
Data used for comparisons between sLFM and csLFM are publicly available on Zenodo (https://doi.org/10.5281/zenodo.8198063)66 and GitHub (https://github.com/THU-IBCS/csLFM-master)67.
References
Fan, J. et al. Video-rate imaging of biological dynamics at centimetre scale and micrometre resolution. Nat. Photonics 13, 809–816 (2019).
Article
CAS
Google Scholar
Condylis, C. et al. Dense functional and molecular readout of a circuit hub in sensory cortex. Science 375, eabl5981 (2022).
Article
CAS
PubMed
PubMed Central
Google Scholar
Weisenburger, S. et al. Volumetric Ca2+ imaging in the mouse brain using hybrid multiplexed sculpted light microscopy. Cell 177, 1050–1066 (2019).
Article
CAS
PubMed
PubMed Central
Google Scholar
Demas, J. et al. High-speed, cortex-wide volumetric recording of neuroactivity at cellular resolution using light beads microscopy. Nat. Methods 18, 1103–1111 (2021).
Article
CAS
PubMed
PubMed Central
Google Scholar
Keller, P. J., Schmidt, A. D., Wittbrodt, J. & Stelzer, E. H. K. Reconstruction of zebrafish early embryonic development by scanned light sheet microscopy. Science 322, 1065–1069 (2008).
Article
CAS
PubMed
Google Scholar
Huang, Q. et al. Intravital imaging of mouse embryos. Science 368, 181–186 (2020).
Article
CAS
PubMed
PubMed Central
Google Scholar
Kitching, A. R. & Hickey, M. J. Immune cell behaviour and dynamics in the kidney—insights from in vivo imaging. Nat. Rev. Nephrol. 18, 22–37 (2022).
Article
PubMed
Google Scholar
Hor, J. L. & Germain, R. N. Intravital and high-content multiplex imaging of the immune system. Trends Cell Biol. 32, 406–420 (2022).
Article
PubMed
Google Scholar
Guo, Y. et al. Visualizing intracellular organelle and cytoskeletal interactions at nanoscale resolution on millisecond timescales. Cell 175, 1430–1442 (2018).
Article
CAS
PubMed
Google Scholar
Knoll, A. H. The multiple origins of complex multicellularity. Annu. Rev. Earth Planet. Sci. 39, 217–239 (2011).
Article
CAS
Google Scholar
Pantazis, P. & Supatto, W. Advances in whole-embryo imaging: a quantitative transition is underway. Nat. Rev. Mol. Cell Biol. 15, 327–339 (2014).
Article
CAS
PubMed
Google Scholar
Liu, T. L. et al. Observing the cell in its native state: imaging subcellular dynamics in multicellular organisms. Science 360, eaaq1392 (2018).
Article
PubMed
PubMed Central
Google Scholar
Yang, B. et al. DaXi—high-resolution, large imaging volume and multi-view single-objective light-sheet microscopy. Nat. Methods 19, 461–469 (2022).
Article
CAS
PubMed
PubMed Central
Google Scholar
Lichtman, J. W. & Conchello, J. A. Fluorescence microscopy. Nat. Methods 2, 910–919 (2005).
Article
CAS
PubMed
Google Scholar
Pittet, M. J. & Weissleder, R. Intravital imaging. Cell 147, 983–991 (2011).
Article
CAS
PubMed
Google Scholar
Giampetraglia, M. & Weigelin, B. Recent advances in intravital microscopy for preclinical research. Curr. Opin. Chem. Biol. 63, 200–208 (2021).
Article
CAS
PubMed
Google Scholar
Shotton, D. & White, N. Confocal scanning microscopy: three-dimensional biological imaging. Trends Biochem. Sci. 14, 435–439 (1989).
Article
CAS
PubMed
Google Scholar
Shotton, D. M. Confocal scanning optical microscopy and its applications for biological specimens. J. Cell Sci. 94, 175–206 (1989).
Article
Google Scholar
Nakano, A. Spinning-disk confocal microscopy—a cutting-edge tool for imaging of membrane traffic. Cell Struct. Funct. 27, 349–355 (2002).
Article
PubMed
Google Scholar
Levoy, M., Ng, R., Adams, A., Footer, M. & Horowitz, M. Light field microscopy. ACM Trans. Graphics 25, 924–934 (2006).
Article
Google Scholar
Prevedel, R. et al. Simultaneous whole-animal 3D imaging of neuronal activity using light-field microscopy. Nat. Methods 11, 727–730 (2014).
Article
CAS
PubMed
PubMed Central
Google Scholar
Guo, C., Liu, W., Hua, X., Li, H. & Jia, S. Fourier light-field microscopy. Opt. Express 27, 25573–25594 (2019).
Article
PubMed
PubMed Central
Google Scholar
Broxton, M. et al. Wave optics theory and 3-D deconvolution for the light field microscope. Opt. Express 21, 25418–25439 (2013).
Article
PubMed
PubMed Central
Google Scholar
Lu, Z. et al. Phase-space deconvolution for light field microscopy. Opt. Express 27, 18131–18145 (2019).
Article
PubMed
Google Scholar
Hua, X., Liu, W. & Jia, S. High-resolution Fourier light-field microscopy for volumetric multi-color live-cell imaging. Optica 8, 614–620 (2021).
Article
PubMed
PubMed Central
Google Scholar
Wagner, N. et al. Instantaneous isotropic volumetric imaging of fast biological processes. Nat. Methods 16, 497–500 (2019).
Article
CAS
PubMed
Google Scholar
Cong, L. et al. Rapid whole brain imaging of neural activity in freely behaving larval zebrafish (Danio rerio). eLife 6, e28158 (2017).
Article
PubMed
PubMed Central
Google Scholar
Yoon, Y.-G. et al. Sparse decomposition light-field microscopy for high speed imaging of neuronal activity. Optica 7, 1457–1468 (2020).
Article
Google Scholar
Nöbauer, T. et al. Video rate volumetric Ca2+ imaging across cortex using seeded iterative demixing (SID) microscopy. Nat. Methods 14, 811–818 (2017).
Article
PubMed
Google Scholar
Zhang, Z. et al. Imaging volumetric dynamics at high speed in mouse and zebrafish brain with confocal light field microscopy. Nat. Biotechnol. 39, 74–83 (2020).
Article
PubMed
Google Scholar
Wu, J. et al. Iterative tomography with digital adaptive optics permits hour-long intravital observation of 3D subcellular dynamics at millisecond scale. Cell 184, 3318–3332 (2021).
Article
CAS
PubMed
Google Scholar
Wu, J. et al. An integrated imaging sensor for aberration-corrected 3D photography. Nature 612, 62–71 (2022).
Article
CAS
PubMed
PubMed Central
Google Scholar
Baumgart, E. & Kubitscheck, U. Scanned light sheet microscopy with confocal slit detection. Opt. Express 20, 21805–21814 (2012).
Article
PubMed
Google Scholar
Kumar, A. et al. Using stage- and slit-scanning to improve contrast and optical sectioning in dual-view inverted light sheet microscopy (diSPIM). Biol. Bull. 231, 26–39 (2016).
Article
CAS
PubMed
PubMed Central
Google Scholar
Wu, Y. et al. Multiview confocal super-resolution microscopy. Nature 600, 279–284 (2021).
Article
CAS
PubMed
PubMed Central
Google Scholar
Zhang, Y. et al. Computational optical sectioning with an incoherent multiscale scattering model for light-field microscopy. Nat. Commun. 12, 6391 (2021).
Article
CAS
PubMed
PubMed Central
Google Scholar
Mihlan, M., Safaiyan, S., Stecher, M., Paterson, N. & Lämmermann, T. Surprises from intravital imaging of the innate immune response. Annu. Rev. Cell Dev. Biol. 38, 467–489 (2022).
Article
CAS
PubMed
Google Scholar
Waite, J. C. et al. Dynamic imaging of the effector immune response to listeria infection in vivo. PLoS Pathog. 7, e1001326 (2011).
Article
CAS
PubMed
PubMed Central
Google Scholar
De Giovanni, M. et al. GPR35 promotes neutrophil recruitment in response to serotonin metabolite 5-HIAA. Cell 185, 815–830 (2022).
Article
PubMed
PubMed Central
Google Scholar
Den Haan, J. M. M. & Kraal, G. Innate immune functions of macrophage subpopulations in the spleen. J. Innate Immun. 4, 437–445 (2012).
Article
Google Scholar
Ma, L. et al. Discovery of the migrasome, an organelle mediating release of cytoplasmic contents during cell migration. Cell Res. 25, 24–38 (2015).
Article
CAS
PubMed
Google Scholar
Zhao, Z. et al. Two-photon synthetic aperture microscopy for minimally invasive fast 3D imaging of native subcellular behaviors in deep tissue. Cell 186, 2475–2491 (2023).
Article
CAS
PubMed
Google Scholar
Wang, Y. et al. Retractosomes: small extracellular vesicles generated from broken-off retraction fibers. Cell Res. 32, 953–956 (2022).
Article
CAS
PubMed
PubMed Central
Google Scholar
Lu, Z. et al. A practical guide to scanning light-field microscope with digital adaptive optics. Nat. Protoc. 17, 1953–1979 (2022).
Article
CAS
PubMed
Google Scholar
Giovannucci, A. et al. CaImAn an open source tool for scalable calcium imaging data analysis. eLife 8, e38173 (2019).
Article
PubMed
PubMed Central
Google Scholar
Stringer, C., Michaelos, M., Tsyboulski, D., Lindo, S. E. & Pachitariu, M. High-precision coding in visual cortex. Cell 184, 2767–2778 (2021).
Article
CAS
PubMed
Google Scholar
Miura, S. K. & Scanziani, M. Distinguishing externally from saccade-induced motion in visual cortex. Nature 610, 135–142 (2022).
Article
CAS
PubMed
PubMed Central
Google Scholar
Kauvar, I. V. et al. Cortical observation by synchronous multifocal optical sampling reveals widespread population encoding of actions. Neuron 107, 351–367 (2020).
Article
CAS
PubMed
PubMed Central
Google Scholar
Yang, H. H. & St-Pierre, F. Genetically encoded voltage indicators: opportunities and challenges. J. Neurosci. 36, 9977–9989 (2016).
Article
CAS
PubMed
PubMed Central
Google Scholar
Lu, Z. et al. Virtual-scanning light-field microscopy for robust snapshot high-resolution volumetric imaging. Nat. Methods 20, 735–746 (2023).
Article
CAS
PubMed
PubMed Central
Google Scholar
Stelzer, E. H. K. et al. Light sheet fluorescence microscopy. Nat. Rev. Methods Prim. 1, 73 (2021).
Article
CAS
Google Scholar
Laissue, P. P., Alghamdi, R. A., Tomancak, P., Reynaud, E. G. & Shroff, H. Assessing phototoxicity in live fluorescence imaging. Nat. Methods 14, 657–661 (2017).
Article
CAS
PubMed
Google Scholar
Barson, D. et al. Simultaneous mesoscopic and two-photon imaging of neuronal activity in cortical circuits. Nat. Methods 17, 107–113 (2020).
Article
CAS
PubMed
Google Scholar
Zhang, Y. et al. Multi-focus light-field microscopy for high-speed large-volume imaging. PhotoniX 3, 30 (2022).
Yu, C.-H. et al. The Cousa objective: a long-working distance air objective for multiphoton imaging in vivo. Nat. Methods 21, 132–141 (2023).
Article
PubMed
PubMed Central
Google Scholar
Wan, H. et al. A bright organic NIR-II nanofluorophore for three-dimensional imaging into biological tissues. Nat. Commun. 9, 1171 (2018).
Article
PubMed
PubMed Central
Google Scholar
Li, X. et al. Reinforcing neuron extraction and spike inference in calcium imaging using deep self-supervised denoising. Nat. Methods 18, 1395–1400 (2021).
Article
CAS
PubMed
Google Scholar
Lecoq, J. et al. Removing independent noise in systems neuroscience data using DeepInterpolation. Nat. Methods 18, 1401–1408 (2021).
Article
CAS
PubMed
PubMed Central
Google Scholar
Wang, Z. et al. Real-time volumetric reconstruction of biological dynamics with light-field microscopy and deep learning. Nat. Methods 18, 551–556 (2021).
Article
CAS
PubMed
PubMed Central
Google Scholar
Mei, E., Fomitchov, P. A., Graves, R. & Campion, M. A line scanning confocal fluorescent microscope using a CMOS rolling shutter as an adjustable aperture. J. Microsc. 247, 269–276 (2012).
Article
CAS
PubMed
Google Scholar
Pelli, D. G. & Vision, S. The VideoToolbox software for visual psychophysics: transforming numbers into movies. Spat. Vis. 10, 437–442 (1997).
Article
CAS
PubMed
Google Scholar
Flierl, M. A. et al. Mouse closed head injury model induced by a weight-drop device. Nat. Protoc. 4, 1328–1337 (2009).
Article
CAS
PubMed
Google Scholar
Seelig, J. D. et al. Two-photon calcium imaging from head-fixed Drosophila during optomotor walking behavior. Nat. Methods 7, 535–540 (2010).
Article
CAS
PubMed
PubMed Central
Google Scholar
Zhao, X., Chen, H., Liu, X. & Cang, J. Orientation-selective responses in the mouse lateral geniculate nucleus. J. Neurosci. 33, 12751–12763 (2013).
Article
CAS
PubMed
PubMed Central
Google Scholar
Hochbaum, D. R. et al. All-optical electrophysiology in mammalian neurons using engineered microbial rhodopsins. Nat. Methods 11, 825–833 (2014).
Article
CAS
PubMed
PubMed Central
Google Scholar
Lu, Z. et al. csLFM-master. https://doi.org/10.5281/zenodo.8198063 (2023).
Lu, Z. et al. csLFM-master. https://github.com/THU-IBCS/csLFM-master (2023).
Download references
Acknowledgements
We thank Z. V. Guo for the preparation of mouse brain slices; M. Schnitzer, C. Huang and Y. Zhong for the gift of Drosophila strains; S. Ding, Z. Jiang and R. Liang for assistance with zebrafish preparation; D. Jiang for discussion of the experimental design; Z. Zhao for assistance with 2pSAM experiments; and F. Sun for the construction of upright sLFM. Z.L. is supported by the China National Postdoctoral Program for Innovative Talent (BX20230174), the Postdoctoral Science Foundation of China (2023M741963) and the Shuimu Tsinghua Scholar Program (2023SM065). J.W. is supported by the Natural Science Foundation of China (62088102, 62071272 and 62231018). Q.D. is supported by the Natural Science Foundation of China (62222508).
Author information
Author notes
These authors contributed equally: Zhi Lu, Siqing Zuo, Minghui Shi.
Authors and Affiliations
Department of Automation, Tsinghua University, Beijing, China
Zhi Lu, Siqing Zuo, Jingyu Xie, Guihua Xiao, Jiamin Wu & Qionghai Dai
Institute for Brain and Cognitive Sciences, Tsinghua University, Beijing, China
Zhi Lu, Siqing Zuo, Jiaqi Fan, Jingyu Xie, Guihua Xiao, Jiamin Wu & Qionghai Dai
Beijing Key Laboratory of Multi-dimension & Multi-scale Computational Photography (MMCP), Tsinghua University, Beijing, China
Zhi Lu, Siqing Zuo, Jiamin Wu & Qionghai Dai
IDG/McGovern Institute for Brain Research, Tsinghua University, Beijing, China
Zhi Lu, Siqing Zuo, Jiamin Wu & Qionghai Dai
Zhejiang Hehu Technology, Hangzhou, China
Zhi Lu
Hangzhou Zhuoxi Institute of Brain and Intelligence, Hangzhou, China
Zhi Lu
State Key Laboratory of Membrane Biology, Tsinghua University–Peking University Joint Center for Life Sciences, Beijing Frontier Research Center for Biological Structure, School of Life Sciences, Tsinghua University, Beijing, China
Minghui Shi & Li Yu
Tsinghua Shenzhen International Graduate School, Tsinghua University, Shenzhen, China
Jiaqi Fan
Shanghai AI Laboratory, Shanghai, China
Jiamin Wu
Beijing National Research Center for Information Science and Technology, Tsinghua University, Beijing, China
Qionghai Dai
Contributions
Q.D., J.W. and L.Y. supervised the research. Q.D., J.W. and Z.L. conceived and designed the project. Z.L. and J.W. designed and built the optical systems. S.Z. performed hardware synchronization. Z.L. and S.Z. performed the numerical simulation and derived the PSF of csLFM. Z.L., J.W. and L.Y. designed the simulation and biological experiments. M.S. and L.Y. prepared cells, zebrafish and mice. J.F. prepared the Drosophila. J.X. and G.X. prepared the visual stimuli experiments. Z.L., S.Z. and M.S. conducted most biological experiments and data collection. Z.L. conducted most data processing and volume reconstructions. Z.L. and S.Z. designed and performed the visualizations. Z.L., J.W., S.Z., M.S., L.Y. and Q.D. prepared figures and wrote the manuscript, with input from all authors.
Corresponding authors
Ethics declarations
Competing interests
Q.D. and J.W. are founders and equity holders of Zhejiang Hehu Technology, which commercializes related techniques. Q.D., J.W. and Z.L. submitted patent applications related to the csLFM technology described in this work. The remaining authors declare no competing interests.
Peer review
Peer review information
Nature Biotechnology thanks Ali Erturk, Weijian Yang and the other, anonymous, reviewer(s) for their contribution to the peer review of this work.
Additional information
Publisher’s note Springer Nature remains neutral with regard to jurisdictional claims in published maps and institutional affiliations.
Supplementary information
Supplementary Information
Supplementary Figs. 1–21, Supplementary Table 1 and titles of Supplementary Videos 1–7.
Supplementary Video 1
Illustrations of csLFM compared to traditional sLFM.
Supplementary Video 2
csLFM reveals the delivery of migrasome between NK cells and macrophages in mammals.
Supplementary Video 3
csLFM reveals the interaction of dendritic cells and T cells through generating and elongating retraction fibers in vivo.
Supplementary Video 4
csLFM reveals retractosome formation in mammals with low excitation light.
Supplementary Video 5
csLFM achieves improved resolution and contrast in recording of neural activity in mammals at 20 VPS.
Supplementary Video 6
csLFM obtains better performance in the whole brain of zebrafish larvae at 20 VPS.
Supplementary Video 7
csLFM realizes high-speed volumetric voltage imaging at 150 VPS with reduced background and enhanced spike resolvability in a Drosophila brain.
Rights and permissions
Open Access This article is licensed under a Creative Commons Attribution 4.0 International License, which permits use, sharing, adaptation, distribution and reproduction in any medium or format, as long as you give appropriate credit to the original author(s) and the source, provide a link to the Creative Commons licence, and indicate if changes were made. The images or other third party material in this article are included in the article’s Creative Commons licence, unless indicated otherwise in a credit line to the material. If material is not included in the article’s Creative Commons licence and your intended use is not permitted by statutory regulation or exceeds the permitted use, you will need to obtain permission directly from the copyright holder. To view a copy of this licence, visit http://creativecommons.org/licenses/by/4.0/.
Reprints and permissions
About this article


Cite this article
Lu, Z., Zuo, S., Shi, M. et al. Long-term intravital subcellular imaging with confocal scanning light-field microscopy.
Nat Biotechnol (2024). https://doi.org/10.1038/s41587-024-02249-5
Download citation
Received: 23 September 2023
Accepted: 17 April 2024
Published: 27 May 2024
DOI: https://doi.org/10.1038/s41587-024-02249-5
>>> Read full article>>>
Copyright for syndicated content belongs to the linked Source : Nature.com – https://www.nature.com/articles/s41587-024-02249-5