

Main
Pooled perturbation screens with high-content readouts ranging from single-cell RNA sequencing (Perturb-seq)1,2,3,4 to imaging-based spatial profiling5,6,7 are now enabling systematic studies of the regulatory circuits that underlie diverse cell phenotypes. Perturb-seq has been applied to various model systems, leading to insights about diverse cellular processes, including the innate immune response2, in vivo effects of autism risk genes in mice8 and organoids9,10 and genome-scale effects on aneuploidy, differentiation and RNA splicing11. Integrating data from population-level genetic screens has also elucidated human disease mechanisms12.
However, owing to the large number of genes in the genome, large-scale Perturb-seq screens are still prohibitively expensive and are often limited by the number of available cells, especially for primary cell systems13 and in vivo niches8. In addition, the exponentially larger number of possible genetic interactions makes it impossible to conduct exhaustive combinatorial screens for genetic interactions using existing approaches, so current Perturb-seq studies of genetic interactions are very modest and focused14. Several approaches have been developed to improve the efficiency of single-cell RNA sequencing (scRNA-seq) and/or Perturb-seq, including overloading droplets with multiple pre-indexed cells (SciFi-seq15) or pooling multiple guides within cells16. However, pre-indexing requires an additional laborious and complex experimental step, and guide-pooling has only been used to study cis and not trans effects of perturbations.
We propose an alternative approach to greatly increase the efficiency and power of Perturb-seq for both single and combinatorial perturbation screens, inspired by theoretical results from compressed sensing17,18,19 that apply to the sparse and modular nature of regulatory circuits in cells. To elaborate, perturbation effects tend to be ‘sparse’, in that most perturbations affect only a small number of genes or co-regulated gene programs2,20. In this scenario, rather than assaying each perturbation individually, we can measure a much smaller number of random combinations of perturbations (forming what we call ‘composite samples’) and accurately learn the effects of individual perturbations from the composite samples using sparsity-promoting algorithms. Moreover, with certain types of composite samples, we can efficiently learn both first-order effects (that is, from single-gene perturbations) and higher-order genetic interaction effects from the same data. We previously showed that experiments that measure random compositions of the underlying biological dataset can greatly increase the efficiency of measuring expression profiles21 and imaging transcriptomics22.
In the present study, we developed two experimental strategies to generate composite samples for Perturb-seq screens, and we introduce here an inference method, Factorize-Recover for Perturb-seq (FR-Perturb), to learn individual perturbation effects from composite samples. We applied our approach to 598 genes in a human macrophage cell line treated with bacterial lipopolysaccharide (LPS). By comparing compressed Perturb-seq to conventional Perturb-seq conducted in the same system, we demonstrate the enhanced efficiency and power of our approach for learning single perturbation effects and second-order genetic interactions. We derive insights into immune regulatory functions and illustrate their connection to human disease mechanisms by integrating data from genome-wide association studies (GWASs) and expression quantitative trait loci (eQTL) studies.
Results
A compressed sensing framework for perturbation screens
In conventional Perturb-seq, each cell in a pool receives one or more genetic perturbations. Each cell is then profiled for the identity of the perturbation(s) and the expression levels of m ≈ 20,000 expressed genes. Our goal is to infer the effect sizes of n perturbations on the phenotype, which can be the entire gene expression profile (n × m matrix) or an aggregate multi-gene phenotype2,3,11, such as an expression program or cell state score (length − n vector). In both cases, we need O(n) samples to learn the effects of n perturbations (Fig. 1a) (where sample replicates introduce a constant factor that is subsumed under the big O notation), such that the number of samples scales linearly with the number of perturbations.
Fig. 1: Framework for compressed Perturb-seq.

a, Schematic for conventional perturbation screen with single-valued phenotype. Each sample (yellow) receives a single perturbation (blue). The required number of samples scales linearly with the number of perturbations, as captured by the O(n) term. b, Schematic for compressed perturbation screen with single-valued phenotype. Each ‘composite’ sample (yellow) represents a random combination of perturbations (blue). The required number of samples scales sub-linearly with the number of perturbations given the following: (1) the effects of the perturbations are sparse (that is, k increases more slowly than n), and (2) sparse inference (typically LASSO) is used to infer the effects from the composite sample phenotypes. c, Schematic for compressed perturbation screen with high-dimensional phenotype, which is the main use case for Perturb-seq. The required number of samples scales sub-linearly with the number of perturbations given the following: (1) the effects of the perturbations are sparse and act on a relatively small number of groups of correlated genes (that is, q and r increase more slowly than n), and (2) sparse inference (namely the ‘factorize-recover’ algorithm23) is used to infer the effects from the composite sample phenotypes. d, Two experimental strategies for generating composite samples for Perturb-seq. Both ‘cell-pooling’ and ‘guide-pooling’ change one step of the conventional Perturb-seq protocol. The result is a sample whose phenotype corresponds to a random linear combination of the phenotypes of samples from the conventional Perturb-seq screen. e, Schematic of computational method used to infer perturbation effects from composite sample phenotypes, based on the ‘factorize-recover’ algorithm23. NGS, next-generation sequencing.
Based on the theory of compressed sensing17, there exist conditions under which far fewer than O(n) samples are sufficient to learn the effects of n perturbations. In general, if the perturbation effects are sparse (that is, relatively few perturbations affect the phenotype) or are sparse in a latent representation (that is, perturbations tend to affect relatively few latent factors that can be combined to ‘explain’ the phenotype), then we can measure a small number of random composite samples (comprising ‘linear combinations’ of individual sample phenotypes) and decompress those measurements to infer the effects of individual perturbations. Composite samples can be generated either by randomly pooling perturbations in individual cells or by randomly pooling cells containing one perturbation each (see below).
The number of required composite samples depends on whether the phenotype is single valued or high dimensional. When the phenotype is single valued (for example, fitness), O(k log n) composite samples suffice to accurately recover the effects of n perturbations18,19, where k is the number of non-zero elements among the n perturbation effects (Fig. 1b). When most perturbations do not affect the phenotype, k grows more slowly than n, and the number of required composite samples scales logarithmically or, at worst, sub-linearly with the number of perturbations. Meanwhile, when the phenotype is an m-dimensional gene expression profile, an efficient approach involves inferring effects on latent expression factors and then reconstructing the effects on individual genes from these factors using the ‘factorize-recover’ algorithm23. This approach requires (Oleft(left(q+rright)log nright)) composite samples, where r is the rank of the n × m perturbation effect size matrix (that is, the maximum number of its linearly independent column vectors), and q is the maximum number of non-zero elements in any column of the left matrix of the factorized effect size matrix (Fig. 1c). In our case, r is the number of distinct groups of ‘co-regulated’ genes whose expression changes concordantly in response to any perturbation, and q is the maximum number of ‘co-functional’ perturbations with non-zero effects on any individual module. Due to the modular nature of gene regulation20,24,25, r and q are expected to remain small when n increases. Indeed, we observed a relatively small number of co-functional and co-regulated gene groups (small q and r, respectively, relative to n) in previous Perturb-seq screens in various systems2,13. Thus, the number of required composite samples will scale logarithmically or, at worst, sub-linearly with n, leading to much fewer required samples than the conventional approach with large n. In simulations, this result held across a wide range of plausible values for q and r (Extended Data Fig. 1). We provide rough estimates of q and r from our own screens (see below) in the Supplementary Note, section 1.
Experimentally generating composite samples
We generated composite samples for compressed Perturb-seq either by randomly pooling cells containing one perturbation each in overloaded scRNA-seq droplets15 (‘cell-pooling’) or by randomly pooling guides in individual cells via infection with a high multiplicity of infection (MOI)2,16 (‘guide-pooling’) (Fig. 1d). Under certain assumptions, the resulting expression counts in each droplet from either method represent a random linear combination of log fold change effect sizes of guides. When cell-pooling, the expression counts in a given droplet are proportional to the average expression counts of the cells in the droplet, which can then be modeled in terms of log fold change effect sizes of the guides in each cell (Methods). When guide-pooling, the expression counts in a given droplet can also be modeled as the sum of log fold change effect sizes (Methods), although this requires the non-trivial assumption that the effect sizes of guides tend to combine additively in log expression space when multiple guides are present in the same cell. Although higher-order genetic interaction effects can, in theory, bias lower-order effect size estimates in guide-pooled data, we note that only a large imbalance in the direction and/or magnitude of higher-order interaction effects across many perturbations will lead to such biases, and that, even in this scenario, many of the lower-order effects can still be accurately estimated (Supplementary Note, section 2).
Either of the two methods described above can be used to learn the same underlying perturbation effects, but each has different strengths and limitations (Discussion). Guide-pooling has a key benefit over cell-pooling, in that the generated data can be used to estimate both first-order effects and higher-order genetic interactions (with appropriate sample sizes and explicit interaction terms in the model) (Methods). In later analyses, we illustrate the feasibility of estimating second-order effects from guide-pooled data.
FR-Perturb infers effects from compressed Perturb-seq
To infer perturbation effects from the composite samples, we devised a method called FR-Perturb based on the ‘factorize-recover’ algorithm23 (Methods). FR-Perturb first factorizes the expression count matrix with sparse factorization (that is, sparse principal component analysis (PCA)), followed by sparse recovery (that is, least absolute shrinkage and selection operator (LASSO)) on the resulting left factor matrix comprising perturbation effects on the latent factors. Finally, it computes perturbation effects on individual genes as the product of the left factor matrix from the recovery step with the right factor matrix (comprising gene weights in each latent factor) from the first factorization step (Fig. 1e and Methods). Because FR-Perturb uses penalized regression, it is not guaranteed to be unbiased. We obtained P values and false discovery rates (FDRs) for all effects by permutation testing (Methods). In later analyses, we evaluated FR-Perturb by comparing it to existing inference methods for Perturb-seq, namely elastic net regression2 and negative binomial regression16.
Compressed Perturb-seq screens of the LPS response
We implemented and evaluated compressed Perturb-seq in the response of THP1 cells (a human monocytic leukemia cell line) to stimulation with LPS when either pooling cells or pooling guides (Fig. 2a,b). In each case, we also performed conventional Perturb-seq, targeting the same genes in the same system for comparison. We selected 598 genes to be perturbed from seven mostly non-overlapping immune response studies (Supplementary Table 1), including genes with roles in the canonical LPS response pathway (34 genes); GWAS for inflammatory bowel disease (IBD) (79 genes) and infection (106 genes); Mendelian immune diseases from the Online Mendelian Inheritance in Man (OMIM) database with keywords for ‘bacterial infection’ (85 genes) and ‘NF-κB’ (102 genes); a previous genome-wide screen for effects on tumor necrosis factor (TNF) expression in mouse bone-marrow-derived dendritic cells (BMDCs)26 (93 genes); and genes with large genetic effects in trans on gene expression from an eQTL study in patient-derived macrophages stimulated with LPS27 (79 genes) (Methods and Supplementary Fig. 1). We designed four single guide RNAs (sgRNAs) for each gene and 500 each of non-targeting or safe-targeting control sgRNAs, resulting in a total pool of 3,392 sgRNAs (Methods). We introduced the sgRNAs into THP1 cells via a modified CROP-seq vector4 (Methods). After transduction and selection, we treated cells with PMA for 24 h and grew them for another 48 h as they differentiated into a macrophage-like state28, and then we treated them with LPS for 3 h before harvesting for scRNA-seq (Methods). As a baseline, we also collected scRNA-seq data for genetically perturbed cells before stimulation (that is, no LPS treatment) (see Supplementary Note, section 3, and Extended Data Fig. 2 for analysis). For our cell-pooled screen, we used CRISPR–Cas9 to knock out genes2, whereas, for our guide-pooled screen, we used CRISPR interference (CRISPRi) with dCas9–KRAB to knock down gene expression1 (Fig. 2a) to avoid cellular toxicity due to multiple double-stranded breaks in individual cells29.
Fig. 2: Experimental overview.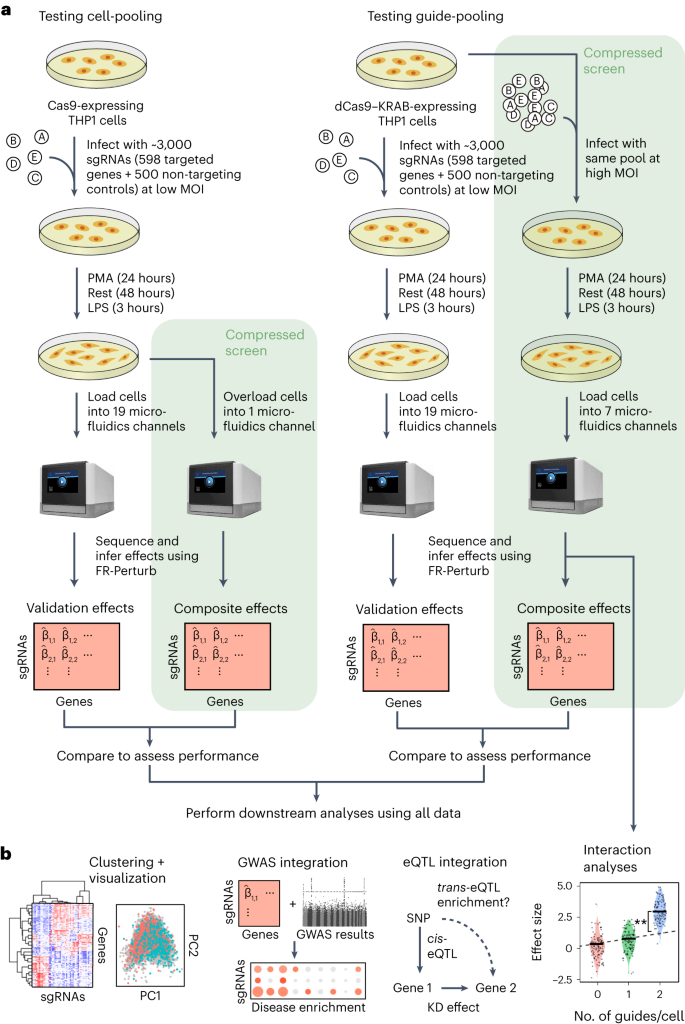

a, Outline of experiments used to test and validate cell-pooling (left) and guide-pooling (right). b, Downstream analyses performed using perturbation effects from all experiments.
By design, the two compressed screens were substantially smaller than their corresponding conventional screens. In the cell-pooled screen, we analyzed a single channel of droplets (10x Genomics; Methods) overloaded with 250,000 cells, whereas, for the corresponding conventional Perturb-seq screen, we analyzed 19 channels at normal loading. We sequenced the library from the overloaded channel to a depth of four-fold more reads than a conventional channel to account for the larger number of non-empty droplets and greater expected RNA content per droplet. After quality control, there were 32,700 droplets containing at least one sgRNA from the overloaded channel (versus 4,576 droplets per channel for a total of 86,954 droplets from the conventional screen) (Fig. 3a), with a mean of 1.86 sgRNAs per non-empty droplet (conventional: 1.11) (Fig. 3b) and a mean of 90 droplets containing a guide for each perturbed gene (conventional: 144) (Fig. 3c). We observed 14,987 total genes with measured expression (conventional: 17,552). Thus, the cell-pooled screen had more than seven times the number of non-empty droplets per channel compared to the conventional screen; considering library preparation and sequencing costs, it was approximately eight times cheaper.
Fig. 3: Evaluating cell-pooled Perturb-seq versus conventional Perturb-seq.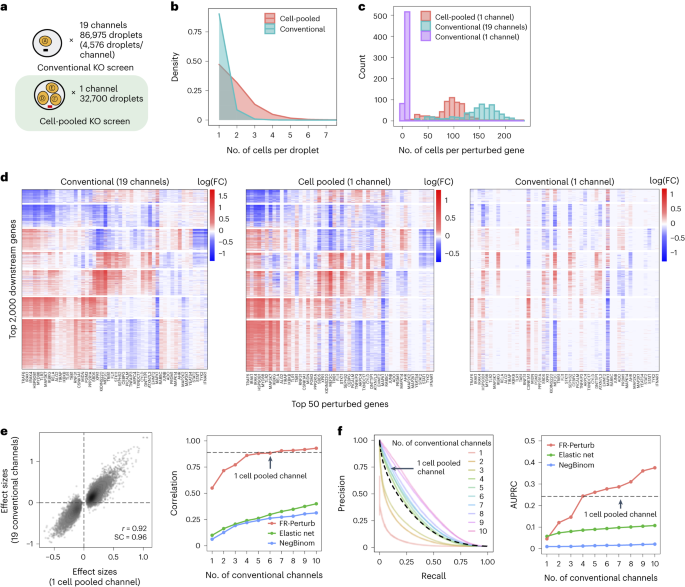

a, Number of channels and droplets from the conventional validation screen (top) and the cell-pooled screen (bottom). b, Distribution of droplets based on the number of cells they contain for the cell-pooled and conventional screens. c, Distribution of the number of cells containing a guide targeting each perturbed gene in the cell-pooled screen and conventional screen (19 channels=full screen, 1 channel=matching number of channels from cell-pooled screen). d, Heat maps of the top effect sizes (inferred with FR-Perturb) from the conventional screen (left), with the same effect sizes shown for the cell-pooled screen (middle) and one equivalent channel of the conventional screen (right). x axis: top 50 perturbed genes, based on their average magnitude of effect on all 17,552 downstream genes. y axis: top 2,000 downstream genes, based on the average magnitude of effects of all 598 perturbed genes acting on them. Rows and columns are clustered based on hierarchical clustering in the leftmost plot. For the left plot, all effects with FDR q > 0.2 are whited out (q value threshold relaxed to 0.5 for the middle and right plots). e, Left, scatter plot of all significant effects (q
>>> Read full article>>>
Copyright for syndicated content belongs to the linked Source : Nature.com – https://www.nature.com/articles/s41587-023-01964-9