


Compact class. With the Predator Triton 14, Acer has expanded its range of compact gaming laptops with an additional model. The 14-inch device offers bags of power, (Core i7-13700H, GeForce RTX 4050), a very bright 16:10 aspect ratio display (WQXGA, 165 Hz, G-Sync) and a Thunderbolt 4 port.
Sascha Mölck, 👁 Florian Glaser, ✓ Sergey Tarasov (translated by Andrew Dickson), Published 07/26/2023 🇩🇪 🇸🇪 …
Processor
Intel Core i7-13700H 14 x 1.8 – 5 GHz, 115 W PL2 / Short Burst, 60 W PL1 / Sustained, Raptor Lake-H
Memory
16 GB
, LPDDR5-6000, dual-channel mode, onboard, no memory slots
Display
14.00 inch 16:10, 2560 x 1600 pixel 216 PPI, BOE NE140QDM-NY1, IPS, G-Sync, glossy: no, 165 Hz
Mainboard
Intel Alder Lake-P PCH
Connections
3 USB 3.1 Gen2, 1 Thunderbolt, USB-C Power Delivery (PD), 1 HDMI, 1 DisplayPort, 1 Kensington Lock, Audio Connections: Headset combined port, Card Reader: MicroSD, 1 Fingerprint Reader, TPM 2.0
Networking
Killer Wi-Fi 6E AX1675i 160MHz Wireless Network Adapter (a/b/g/n=Wi-Fi 4/ac=Wi-Fi 5/ax=Wi-Fi 6/), Bluetooth 5.3
Size
height x width x depth (in mm): 19.81 x 312.42 x 226.06 (=0.78 x 12.3 x 8.9 in)
Operating System
Microsoft Windows 11 Home
Camera
Webcam: FHD
Primary Camera: 2.1 MPix
Additional features
Speakers: Stereo, Keyboard: Chiclet, Keyboard Light: yes, ExpressVPN (Trial), McAfee LiveSafe (Trial), Microsoft 365 (Trial), Microsoft OneNote (Trial), 24 Months Warranty
Weight
1.72 kg (= 60.67 oz / 3.79 pounds), Power Supply: 730 g (= 25.75 oz / 1.61 pounds)
Note: The manufacturer may use components from different suppliers including display panels, drives or memory sticks with similar specifications.
The laptop’s technology is housed in a silver-gray metal case. Acer has opted for smooth, matte surfaces. The compact computer doesn’t offer any eye-catching design elements meaning it can also pass as an office laptop. Likewise, extravagant LED bars are also absent. In addition to the key lighting, a small illuminated Predator logo on the palm rest mixes things up color-wise.
The Triton does not show any signs of manufacturing flaws. The gap dimensions are correct and no excess material protrudes from the device. The base unit and the lid can be twisted slightly but all within an acceptable range. Pressure placed on the rear of the lid does not result in any image distortions. The hinges hold the lid firmly in place with the maximum opening angle coming in at around 175 degrees. Opening the device one-handed is possible.
Regarding the dimensions, there’s not much to choose between most of the competing devices. The MSI Stealth 14 Studio A13V is the exception to the rule: It takes up more space than the competition. When it comes to weight, the Acer laptop finds itself in the middle of the pack.
MSI Stealth 14 Studio A13V Acer Predator Triton 14 PT14-51 Asus ROG Zephyrus G14 GA402RJ Razer Blade 14 RTX 4070 Apple MacBook Pro 14 2023 M2 Pro Entry Gigabyte Aero 14 OLED BMF DIN A4 ❌
315 mm / 12.4 inch
246.6 mm / 9.71 inch
19 mm / 0.748 inch
1.7 kg3.76 lbs312.42 mm / 12.3 inch
226.06 mm / 8.9 inch
19.81 mm / 0.78 inch
1.7 kg3.79 lbs312 mm / 12.3 inch
227 mm / 8.94 inch
19.5 mm / 0.768 inch
1.7 kg3.75 lbs310.7 mm / 12.2 inch
228 mm / 8.98 inch
17.99 mm / 0.708 inch
1.8 kg4.07 lbs312.6 mm / 12.3 inch
221.2 mm / 8.71 inch
15.5 mm / 0.61 inch
1.6 kg3.54 lbs311 mm / 12.2 inch
220.8 mm / 8.69 inch
17 mm / 0.669 inch
1.4 kg3.1 lbs297 mm / 11.7 inch
210 mm / 8.27 inch
1 mm / 0.03937 inch
5.7 g0.01257 lbs
The selection of ports is quite limited: The PT14 can call two USB-A ports (USB 3.2 Gen 2) and a USB-C port (Thunderbolt 4) its own. The USB-C port supports Power Delivery and can output a Displayport signal. There are a total of two video outputs (HDMI 2.1, DP). An audio jack completes the package.
The MicroSD memory card reader (reference card: AV PRO microSD 128 GB V60) belongs to the slowest models with its maximum transfer speeds of 19 MB/s (the transfer of 250 jpg image files at around 5 MB each) and 26 MB/s (copying large data blocks).
Under optimum conditions (no Wi-Fi devices nearby, a short distance between the laptop and the server PC), wonderful Wi-Fi data speeds can be achieved. The laptop has a Wi-Fi 6E chip (Killer AX1675i) on board. An ethernet port is not available.
0501001502002503003504004505005506006507007508008509009501000105011001150120012501300135014001450150015501600165017001750Tooltip
The webcam (2.1 MP, max. 1,920 x 1,080 pixels) doesn’t come with a mechanical shutter. However, in terms of quality, it cannot set itself apart from the competition. It falters in the area of color accuracy with the colors deviating from their target value.

8.7 ∆E
11.5 ∆E
7.3 ∆E
2.8 ∆E
6.5 ∆E
7.4 ∆E
13 ∆E
11.9 ∆E
9.5 ∆E
5.4 ∆E
5.2 ∆E
7.5 ∆E
6.1 ∆E
5.1 ∆E
6.5 ∆E
6.7 ∆E
5.5 ∆E
9.4 ∆E
3.8 ∆E
8.4 ∆E
8.1 ∆E
7.4 ∆E
8.8 ∆E
10.6 ∆E
ColorChecker Acer Predator Triton 14 PT14-51: 7.62 ∆E min: 2.8 – max: 13.03 ∆E
On top of the usual documents (quick start guide and warranty information), no additional accessories are included with the laptop.
After removing all of the screws on the base of the device, the lower shell can be removed with the help of a plectrum. Consequently, this helps gain access to the SSD (PCIe 4, M.2 2280), the BIOS battery, the Wi-Fi module, fans, speakers and the battery.
 Acer Predator Triton 14 hardware
Acer has granted the 14-inch device a two-year warranty (applicable to Germany). Extending this to three years costs almost $100.
The chiclet keyboard’s flat, smooth keys (RGB lighting) have short travel and a clearly defined pressure point and nice key resistance. When typing, the keyboard doesn’t wobble. Good: All four arrow keys are normal-sized. Overall, Acer has provided a keyboard suitable for everyday use.
A mouse alternative comes in the form of a multi-touch capable Clickpad (around 10.5 x 6.5 cm) across which the user’s fingers gilde effortlessly. It enjoys short travel and a clearly defined pressure point.
 Predator Triton 14 keyboard
![]() Subpixels
Subpixels
Acer has equipped its Predator with a 14-inch display (2,560 x 1,600 pixels) in a work-friendly, 16:10 aspect ratio. On the plus side, there is G-Sync support, the absence of PWM flickering, short response times and high average brightness of 516.2 cd/m². The contrast ratio (944:1) just misses its target value (> 1.000:1).
The alternatively available mini-LED display (2,560 x 1,600 pixels) ought to have significantly higher contrast and comes with a DisplayHDR 600 certification.
498
cd/m²482
cd/m²487
cd/m²529
cd/m²547
cd/m²512
cd/m²528
cd/m²519
cd/m²544
cd/m²
Distribution of brightness
BOE NE140QDM-NY1
X-Rite i1Pro 2
Maximum: 547 cd/m² (Nits) Average: 516.2 cd/m² Minimum: 21 cd/m²
Brightness Distribution: 88 %
Center on Battery: 547 cd/m²
Contrast: 977:1 (Black: 0.56 cd/m²)
ΔE Color 3.28 | 0.55-29.43 Ø5.1, calibrated: 1.09
ΔE Greyscale 4.4 | 0.57-98 Ø5.4
85.5% AdobeRGB 1998 (Argyll 2.2.0 3D)
99.9% sRGB (Argyll 2.2.0 3D)
96.9% Display P3 (Argyll 2.2.0 3D)
Gamma: 2.168
Acer Predator Triton 14 PT14-51
BOE NE140QDM-NY1, IPS, 2560×1600, 14.00Razer Blade 14 RTX 4070
AU Optronics B140QAN06.U, IPS, 2560×1600, 14.00Asus ROG Zephyrus G14 GA402RJ
BOEhydis NE140QDM-NX1, IPS, 2560×1600, 14.00MSI Stealth 14 Studio A13V
B140QAN06.T, IPS, 2560×1600, 14.00Gigabyte Aero 14 OLED BMF
Samsung SDC4192 (ATNA40YK14-0), OLED, 2880×1800, 14.00Apple MacBook Pro 14 2023 M2 Pro Entry
Mini-LED, 3024×1964, 14.20 Display P3 Coverage
96.9
97.3
0%
97.6
1%
96.2
-1%
99.8
3%
sRGB Coverage
99.9
99.8
0%
99.9
0%
99.6
0%
100
0%
AdobeRGB 1998 Coverage
85.5
85.3
0%
85.6
0%
85.3
0%
88.7
4%
Response Time Grey 50% / Grey 80% *
15.1 ?(6.8, 8.3)
11.9 ?(5.6, 6.3)
21%
8.3 ?(3.5, 4.8)
45%
5.5 ?(2.7, 2.8)
64%
2.4 ?(1.4, 1)
84%
Response Time Black / White *
5.8 ?(2.1, 3.7)
8 ?(4, 4)
-38%
6 ?(1.8, 4.2)
-3%
5.8 ?(2.1, 3.7)
-0%
2.4 ?(1.4, 1)
59%
PWM Frequency
26191 ?(35)
300
Brightness middle
547
559.3
2%
500
-9%
419
-23%
423
-23%
Brightness
516
560
9%
470
-9%
402
-22%
427
-17%
Brightness Distribution
88
88
0%
85
-3%
89
1%
98
11%
Black Level *
0.56
0.44
21%
0.42
25%
0.43
23%
0.1
82%
Contrast
977
1271
30%
1190
22%
974
0%
4230
333%
Colorchecker dE 2000 *
3.28
4.44
-35%
2.45
25%
2.3
30%
0.55
83%
Colorchecker dE 2000 max. *
8.57
9.3
-9%
5.34
38%
5.8
32%
1.15
87%
Colorchecker dE 2000 calibrated *
1.09
0.39
64%
1.2
-10%
0.9
17%
1.15
-6%
Greyscale dE 2000 *
4.4
6.8
-55%
3.1
30%
3.3
25%
0.69
84%
Gamma
2.168 101%
2.3 96%
2.213 99%
2.14 103%
2.42 91%
CCT
7767 84%
6242 104%
7251 90%
6550 99%
6479 100%
* … smaller is better
Out-of-the-box, the screen has decent color reproduction: With a deviation of around 3.3, the target value (DeltaE
We have created our very own color profile which can be downloaded and used. A link for this can be found in the “Display” inbox.
Display Response Times
ℹ
Display response times show how fast the screen is able to change from one color to the next. Slow response times can lead to afterimages and can cause moving objects to appear blurry (ghosting). Gamers of fast-paced 3D titles should pay special attention to fast response times.
Screen Flickering / PWM (Pulse-Width Modulation)
ℹ
To dim the screen, some notebooks will simply cycle the backlight on and off in rapid succession – a method called Pulse Width Modulation (PWM) . This cycling frequency should ideally be undetectable to the human eye. If said frequency is too low, users with sensitive eyes may experience strain or headaches or even notice the flickering altogether.
Screen flickering / PWM not detected
In comparison: 54 % of all tested devices do not use PWM to dim the display. If PWM was detected, an average of 18893 (minimum: 5 – maximum: 3846000) Hz was measured.
The IPS panel has stable viewing angles and is legible from every position. Thanks to the display’s high brightness, the screen can also be viewed in an outdoor setting.
The laptop offers six manufacturer-specific system modes – four in mains operation and two in battery mode (see table). We used the “Balanced” (benchmarks) and “Eco” (battery tests) modes. “Turbo” and “Performance” are only available when plugged into the wall (battery level> 30 %).
One key located above the keyboard is responsible for fast switching between the modes. Alternatively, this can be done via the PredatorSense software (the laptop’s control center). An LED displays the active mode.
Turbo
Performance
Balanced
Quiet
Balanced (Battery)
Eco (Battery)
Power Limit 1 (HWInfo)
80 watts
75 watts
60 watts
50 watts
60 watts
25 watts
Power Limit 2 (HWInfo)
115 watts
115 watts
115 watts
115 watts
115 watts
30 watts
Noise (Witcher 3)
56 dB(A)
53 dB(A)
43 dB(A)
36 dB(A)
–
–
Performance (Witcher 3)
~86 fps
~83 fps
~82 fps
~58 fps
–
–
The Core i7-13700H processor (Raptor Lake) consists of eight efficiency cores (no hyperthreading, 1.8 to 3.7 GHz) and six performance cores (hyperthreading, 2.4 to 5 GHz). In total, this represents a total of 20 logical CPU cores.
The benchmark results are above the typical CPU average – regardless of the selected performance mode. The relevant single-thread performance (179 points) drops less in battery mode than the multi-thread performance (992 points).
Under continuous multi-thread load (CB15 loop) the turbo clock speed drops from the first to the third run. Subsequently, a consistent level is maintained. The “Turbo” profile ensures minimally higher results. Generally, the difference between the modes is very small.
01503004506007509001050120013501500165018001950210022502400255027002850Tooltip
Cinebench R15 CPU Multi 64Bit
2982 Points
Cinebench R15 OpenGL 64Bit
191.6 fps
Cinebench R15 Ref. Match 64Bit
99.6 %
Cinebench R15 CPU Single 64Bit
245 Points
Help
The smooth-running system has enough power at its disposal for demanding applications such as rendering and gaming – something confirmed by the good PC Mark results. The RAM’s transfer rates are within a normal range for LPDDR5-6000 RAM.
Razer Blade 14 RTX 4070
NVIDIA GeForce RTX 4070 Laptop GPU, R9 7940HS, Samsung PM9A1 MZVL21T0HCLR
8205 Points ∼100% +11%
Acer Predator Triton 14 PT14-51
NVIDIA GeForce RTX 4050 Laptop GPU, i7-13700H, Micron 3400 MTFDKBA512TFH 512GB
7402 Points ∼90%
Asus ROG Zephyrus G14 GA402RJ
Radeon RX 6700S, R7 6800HS, Micron 2450 1TB MTFDKBA1T0TFK
7345 Points ∼90% -1%
Average of class Gaming
(4477 – 9331, n=199, last 2 years)
7323 Points ∼89% -1%
Gigabyte Aero 14 OLED BMF
NVIDIA GeForce RTX 4050 Laptop GPU, i7-13700H, Gigabyte AG470S1TB-SI B10
7273 Points ∼89% -2%
Average Intel Core i7-13700H, NVIDIA GeForce RTX 4050 Laptop GPU
(6822 – 7556, n=7)
7220 Points ∼88% -2%
MSI Stealth 14 Studio A13V
NVIDIA GeForce RTX 4050 Laptop GPU, i7-13700H, Samsung PM9A1 MZVL21T0HCLR
6924 Points ∼84% -6%
Gigabyte Aero 14 OLED BMF
NVIDIA GeForce RTX 4050 Laptop GPU, i7-13700H, Gigabyte AG470S1TB-SI B10
11549 Points ∼100% +10%
Razer Blade 14 RTX 4070
NVIDIA GeForce RTX 4070 Laptop GPU, R9 7940HS, Samsung PM9A1 MZVL21T0HCLR
10952 Points ∼95% +4%
Average Intel Core i7-13700H, NVIDIA GeForce RTX 4050 Laptop GPU
(10283 – 11549, n=7)
10915 Points ∼95% +4%
Average of class Gaming
(7334 – 12176, n=198, last 2 years)
10514 Points ∼91% 0%
Acer Predator Triton 14 PT14-51
NVIDIA GeForce RTX 4050 Laptop GPU, i7-13700H, Micron 3400 MTFDKBA512TFH 512GB
10512 Points ∼91%
MSI Stealth 14 Studio A13V
NVIDIA GeForce RTX 4050 Laptop GPU, i7-13700H, Samsung PM9A1 MZVL21T0HCLR
10283 Points ∼89% -2%
Asus ROG Zephyrus G14 GA402RJ
Radeon RX 6700S, R7 6800HS, Micron 2450 1TB MTFDKBA1T0TFK
10149 Points ∼88% -3%
Razer Blade 14 RTX 4070
NVIDIA GeForce RTX 4070 Laptop GPU, R9 7940HS, Samsung PM9A1 MZVL21T0HCLR
10805 Points ∼100% +10%
Acer Predator Triton 14 PT14-51
NVIDIA GeForce RTX 4050 Laptop GPU, i7-13700H, Micron 3400 MTFDKBA512TFH 512GB
9836 Points ∼91%
Average of class Gaming
(6161 – 11833, n=198, last 2 years)
9522 Points ∼88% -3%
Asus ROG Zephyrus G14 GA402RJ
Radeon RX 6700S, R7 6800HS, Micron 2450 1TB MTFDKBA1T0TFK
9429 Points ∼87% -4%
Gigabyte Aero 14 OLED BMF
NVIDIA GeForce RTX 4050 Laptop GPU, i7-13700H, Gigabyte AG470S1TB-SI B10
9390 Points ∼87% -5%
Average Intel Core i7-13700H, NVIDIA GeForce RTX 4050 Laptop GPU
(8368 – 9836, n=7)
9245 Points ∼86% -6%
MSI Stealth 14 Studio A13V
NVIDIA GeForce RTX 4050 Laptop GPU, i7-13700H, Samsung PM9A1 MZVL21T0HCLR
8368 Points ∼77% -15%
Razer Blade 14 RTX 4070
NVIDIA GeForce RTX 4070 Laptop GPU, R9 7940HS, Samsung PM9A1 MZVL21T0HCLR
12666 Points ∼100% +19%
Asus ROG Zephyrus G14 GA402RJ
Radeon RX 6700S, R7 6800HS, Micron 2450 1TB MTFDKBA1T0TFK
11237 Points ∼89% +6%
Average of class Gaming
(5288 – 16424, n=198, last 2 years)
10715 Points ∼85% +1%
Acer Predator Triton 14 PT14-51
NVIDIA GeForce RTX 4050 Laptop GPU, i7-13700H, Micron 3400 MTFDKBA512TFH 512GB
10643 Points ∼84%
MSI Stealth 14 Studio A13V
NVIDIA GeForce RTX 4050 Laptop GPU, i7-13700H, Samsung PM9A1 MZVL21T0HCLR
10472 Points ∼83% -2%
Average Intel Core i7-13700H, NVIDIA GeForce RTX 4050 Laptop GPU
(9527 – 10643, n=7)
10142 Points ∼80% -5%
Gigabyte Aero 14 OLED BMF
NVIDIA GeForce RTX 4050 Laptop GPU, i7-13700H, Gigabyte AG470S1TB-SI B10
9627 Points ∼76% -10%
Acer Predator Triton 14 PT14-51
NVIDIA GeForce RTX 4050 Laptop GPU, i7-13700H, Micron 3400 MTFDKBA512TFH 512GB
1865 Points ∼100%
Gigabyte Aero 14 OLED BMF
NVIDIA GeForce RTX 4050 Laptop GPU, i7-13700H, Gigabyte AG470S1TB-SI B10
1842 Points ∼99% -1%
Average of class Gaming
(974 – 2295, n=139, last 2 years)
1834 Points ∼98% -2%
Razer Blade 14 RTX 4070
NVIDIA GeForce RTX 4070 Laptop GPU, R9 7940HS, Samsung PM9A1 MZVL21T0HCLR
1812 Points ∼97% -3%
Apple MacBook Pro 14 2023 M2 Pro Entry
M2 Pro 16-Core GPU, M2 Pro 10-Core, Apple SSD AP0512Z
1772 Points ∼95% -5%
MSI Stealth 14 Studio A13V
NVIDIA GeForce RTX 4050 Laptop GPU, i7-13700H, Samsung PM9A1 MZVL21T0HCLR
1734 Points ∼93% -7%
Average Intel Core i7-13700H, NVIDIA GeForce RTX 4050 Laptop GPU
(1205 – 1937, n=9)
1733 Points ∼93% -7%
Gigabyte Aero 14 OLED BMF
NVIDIA GeForce RTX 4050 Laptop GPU, i7-13700H, Gigabyte AG470S1TB-SI B10
1793 Points ∼100% +2%
Razer Blade 14 RTX 4070
NVIDIA GeForce RTX 4070 Laptop GPU, R9 7940HS, Samsung PM9A1 MZVL21T0HCLR
1762 Points ∼98% +1%
Average of class Gaming
(907 – 2166, n=139, last 2 years)
1755 Points ∼98% 0%
Acer Predator Triton 14 PT14-51
NVIDIA GeForce RTX 4050 Laptop GPU, i7-13700H, Micron 3400 MTFDKBA512TFH 512GB
1753 Points ∼98%
Average Intel Core i7-13700H, NVIDIA GeForce RTX 4050 Laptop GPU
(1158 – 1877, n=9)
1650 Points ∼92% -6%
MSI Stealth 14 Studio A13V
NVIDIA GeForce RTX 4050 Laptop GPU, i7-13700H, Samsung PM9A1 MZVL21T0HCLR
1631 Points ∼91% -7%
Apple MacBook Pro 14 2023 M2 Pro Entry
M2 Pro 16-Core GPU, M2 Pro 10-Core, Apple SSD AP0512Z
1543 Points ∼86% -12%
Apple MacBook Pro 14 2023 M2 Pro Entry
M2 Pro 16-Core GPU, M2 Pro 10-Core, Apple SSD AP0512Z
2239 Points ∼100% +11%
Acer Predator Triton 14 PT14-51
NVIDIA GeForce RTX 4050 Laptop GPU, i7-13700H, Micron 3400 MTFDKBA512TFH 512GB
2026 Points ∼90%
Average of class Gaming
(1027 – 2514, n=139, last 2 years)
1979 Points ∼88% -2%
Razer Blade 14 RTX 4070
NVIDIA GeForce RTX 4070 Laptop GPU, R9 7940HS, Samsung PM9A1 MZVL21T0HCLR
1952 Points ∼87% -4%
Gigabyte Aero 14 OLED BMF
NVIDIA GeForce RTX 4050 Laptop GPU, i7-13700H, Gigabyte AG470S1TB-SI B10
1925 Points ∼86% -5%
MSI Stealth 14 Studio A13V
NVIDIA GeForce RTX 4050 Laptop GPU, i7-13700H, Samsung PM9A1 MZVL21T0HCLR
1909 Points ∼85% -6%
Average Intel Core i7-13700H, NVIDIA GeForce RTX 4050 Laptop GPU
(1293 – 2044, n=9)
1866 Points ∼83% -8%
Acer Predator Triton 14 PT14-51
NVIDIA GeForce RTX 4050 Laptop GPU, i7-13700H, Micron 3400 MTFDKBA512TFH 512GB
1754 Points ∼100%
Gigabyte Aero 14 OLED BMF
NVIDIA GeForce RTX 4050 Laptop GPU, i7-13700H, Gigabyte AG470S1TB-SI B10
1725 Points ∼98% -2%
Average of class Gaming
(1029 – 2275, n=139, last 2 years)
1681 Points ∼96% -4%
Average Intel Core i7-13700H, NVIDIA GeForce RTX 4050 Laptop GPU
(1097 – 1929, n=9)
1608 Points ∼92% -8%
Razer Blade 14 RTX 4070
NVIDIA GeForce RTX 4070 Laptop GPU, R9 7940HS, Samsung PM9A1 MZVL21T0HCLR
1575 Points ∼90% -10%
MSI Stealth 14 Studio A13V
NVIDIA GeForce RTX 4050 Laptop GPU, i7-13700H, Samsung PM9A1 MZVL21T0HCLR
1560 Points ∼89% -11%
Apple MacBook Pro 14 2023 M2 Pro Entry
M2 Pro 16-Core GPU, M2 Pro 10-Core, Apple SSD AP0512Z
1329 Points ∼76% -24%
PCMark 8 Home Score Accelerated v2
5120 pointsPCMark 8 Work Score Accelerated v2
5617 pointsPCMark 10 Score
7402 points
Help
The standardized Latency Monitor test (internet surfing, 4k video playback, Prime95) revealed abnormalities. The system doesn’t appear to be suitable for real time video and audio editing. Future software updates could either improve or worsen matters.
Gigabyte Aero 14 OLED BMF
NVIDIA GeForce RTX 4050 Laptop GPU, i7-13700H, Gigabyte AG470S1TB-SI B10
2089.1 μs * ∼100% -35%
MSI Stealth 14 Studio A13V
NVIDIA GeForce RTX 4050 Laptop GPU, i7-13700H, Samsung PM9A1 MZVL21T0HCLR
1558.8 μs * ∼75% -0%
Acer Predator Triton 14 PT14-51
NVIDIA GeForce RTX 4050 Laptop GPU, i7-13700H, Micron 3400 MTFDKBA512TFH 512GB
1552.5 μs * ∼74%
Asus ROG Zephyrus G14 GA402RJ
Radeon RX 6700S, R7 6800HS, Micron 2450 1TB MTFDKBA1T0TFK
1111.5 μs * ∼53% +28%
Razer Blade 14 RTX 4070
NVIDIA GeForce RTX 4070 Laptop GPU, R9 7940HS, Samsung PM9A1 MZVL21T0HCLR
615.1 μs * ∼29% +60%
* … smaller is better
Storage stinginess at Acer: The installed PCIe 4 SSD (M.2 2280) has a capacity of only 512 GB – not enough for a gaming laptop and especially one in this price category. The Micron SSD is very decent but does not have outstanding transfer speeds. Cons: In the course of the DiskSpd loop, there are performance dips due to thermal throttling. There is no space for an additional storage medium.
 A PCI-Express 4 SSD serves as the system drive.
CDM 5/6 Read Seq Q32T1:
6342 MB/s
CDM 5/6 Write Seq Q32T1:
3857 MB/s
CDM 5/6 Read 4K Q32T1:
862.5 MB/s
CDM 5/6 Write 4K Q32T1:
717.8 MB/s
CDM 5 Read Seq:
2887 MB/s
CDM 5 Write Seq:
3831 MB/s
CDM 5/6 Read 4K:
62.14 MB/s
CDM 5/6 Write 4K:
252 MB/s
Razer Blade 14 RTX 4070
Samsung PM9A1 MZVL21T0HCLR
4226 (4199.97min – 4225.55max) MB/s ∼100% +90%
MSI Stealth 14 Studio A13V
Samsung PM9A1 MZVL21T0HCLR
4040 (4016.61min – 4040.26max) MB/s ∼96% +82%
Average of class Gaming
(1049 – 6045, n=200, last 2 years)
3249 MB/s ∼77% +46%
Average Micron 3400 MTFDKBA512TFH 512GB
(1842 – 3473, n=8)
2611 MB/s ∼62% +18%
Gigabyte Aero 14 OLED BMF
Gigabyte AG470S1TB-SI B10
2582 (2345.38min – 2582.01max) MB/s ∼61% +16%
Acer Predator Triton 14 PT14-51
Micron 3400 MTFDKBA512TFH 512GB
2220 (2128.4min – 2220.05max) MB/s ∼53%
Asus ROG Zephyrus G14 GA402RJ
Micron 2450 1TB MTFDKBA1T0TFK
2083 (2073.03min – 2082.92max) MB/s ∼49% -6%
MSI Stealth 14 Studio A13V
Samsung PM9A1 MZVL21T0HCLR
4277 (4221.99min – 4277.39max) MB/s ∼100% +12%
Razer Blade 14 RTX 4070
Samsung PM9A1 MZVL21T0HCLR
4267 (4237.63min – 4267.14max) MB/s ∼100% +12%
Acer Predator Triton 14 PT14-51
Micron 3400 MTFDKBA512TFH 512GB
3810 (2302.68min – 3809.69max) MB/s ∼89%
Average of class Gaming
(399 – 9108, n=199, last 2 years)
3459 MB/s ∼81% -9%
Average Micron 3400 MTFDKBA512TFH 512GB
(2672 – 3933, n=8)
3386 MB/s ∼79% -11%
Asus ROG Zephyrus G14 GA402RJ
Micron 2450 1TB MTFDKBA1T0TFK
3237 (949.8min – 3236.98max) MB/s ∼76% -15%
Gigabyte Aero 14 OLED BMF
Gigabyte AG470S1TB-SI B10
2236 (2165.59min – 2236.4max) MB/s ∼52% -41%
MSI Stealth 14 Studio A13V
Samsung PM9A1 MZVL21T0HCLR
7037 (6407.22min – 7036.55max) MB/s ∼100% +8%
Gigabyte Aero 14 OLED BMF
Gigabyte AG470S1TB-SI B10
6868 (5469.58min – 6868.07max) MB/s ∼98% +6%
Razer Blade 14 RTX 4070
Samsung PM9A1 MZVL21T0HCLR
6694 (5769.89min – 6693.72max) MB/s ∼95% +3%
Acer Predator Triton 14 PT14-51
Micron 3400 MTFDKBA512TFH 512GB
6487 (5478.39min – 6487.33max) MB/s ∼92%
Average Micron 3400 MTFDKBA512TFH 512GB
(4989 – 6628, n=8)
6210 MB/s ∼88% -4%
Average of class Gaming
(1620 – 16089, n=200, last 2 years)
5703 MB/s ∼81% -12%
Asus ROG Zephyrus G14 GA402RJ
Micron 2450 1TB MTFDKBA1T0TFK
3563 (3320.84min – 3562.65max) MB/s ∼51% -45%
MSI Stealth 14 Studio A13V
Samsung PM9A1 MZVL21T0HCLR
5248 (5190.35min – 5248.12max) MB/s ∼100% +36%
Razer Blade 14 RTX 4070
Samsung PM9A1 MZVL21T0HCLR
5009 (4995.49min – 5008.84max) MB/s ∼95% +30%
Average of class Gaming
(86.2 – 14571, n=200, last 2 years)
4228 MB/s ∼81% +9%
Acer Predator Triton 14 PT14-51
Micron 3400 MTFDKBA512TFH 512GB
3867 (3727.06min – 3866.75max) MB/s ∼74%
Average Micron 3400 MTFDKBA512TFH 512GB
(2036 – 4336, n=8)
3757 MB/s ∼72% -3%
Gigabyte Aero 14 OLED BMF
Gigabyte AG470S1TB-SI B10
3742 (3596.76min – 3741.95max) MB/s ∼71% -3%
Asus ROG Zephyrus G14 GA402RJ
Micron 2450 1TB MTFDKBA1T0TFK
3287 (3261.26min – 3287.42max) MB/s ∼63% -15%
MSI Stealth 14 Studio A13V
Samsung PM9A1 MZVL21T0HCLR
81.2 (79.79min – 81.21max) MB/s ∼100% +44%
Gigabyte Aero 14 OLED BMF
Gigabyte AG470S1TB-SI B10
77.9 (72.17min – 77.89max) MB/s ∼96% +38%
Razer Blade 14 RTX 4070
Samsung PM9A1 MZVL21T0HCLR
76.1 (75.22min – 76.13max) MB/s ∼94% +35%
Average of class Gaming
(29.9 – 97.4, n=200, last 2 years)
66.5 MB/s ∼82% +18%
Asus ROG Zephyrus G14 GA402RJ
Micron 2450 1TB MTFDKBA1T0TFK
59.7 (59.49min – 59.72max) MB/s ∼74% +6%
Acer Predator Triton 14 PT14-51
Micron 3400 MTFDKBA512TFH 512GB
56.3 (54.55min – 56.27max) MB/s ∼69%
Average Micron 3400 MTFDKBA512TFH 512GB
(39.8 – 67.2, n=8)
55.5 MB/s ∼68% -1%
Gigabyte Aero 14 OLED BMF
Gigabyte AG470S1TB-SI B10
313 (305.92min – 312.76max) MB/s ∼100% +20%
Acer Predator Triton 14 PT14-51
Micron 3400 MTFDKBA512TFH 512GB
260 (256.38min – 259.82max) MB/s ∼83%
MSI Stealth 14 Studio A13V
Samsung PM9A1 MZVL21T0HCLR
237 (234.46min – 236.6max) MB/s ∼76% -9%
Asus ROG Zephyrus G14 GA402RJ
Micron 2450 1TB MTFDKBA1T0TFK
225 (223.07min – 224.58max) MB/s ∼72% -13%
Average of class Gaming
(66.6 – 421, n=199, last 2 years)
217 MB/s ∼69% -17%
Razer Blade 14 RTX 4070
Samsung PM9A1 MZVL21T0HCLR
189.1 (187.76min – 189.09max) MB/s ∼60% -27%
Average Micron 3400 MTFDKBA512TFH 512GB
(121.2 – 260, n=8)
159.3 MB/s ∼51% -39%
Razer Blade 14 RTX 4070
Samsung PM9A1 MZVL21T0HCLR
4165 (4149.71min – 4164.91max) MB/s ∼100% +180%
Gigabyte Aero 14 OLED BMF
Gigabyte AG470S1TB-SI B10
3543 (3531.54min – 3542.72max) MB/s ∼85% +139%
MSI Stealth 14 Studio A13V
Samsung PM9A1 MZVL21T0HCLR
3387 (3233.01min – 3387.37max) MB/s ∼81% +128%
Average of class Gaming
(313 – 5829, n=199, last 2 years)
2414 MB/s ∼58% +63%
Asus ROG Zephyrus G14 GA402RJ
Micron 2450 1TB MTFDKBA1T0TFK
1846 (1840.32min – 1845.53max) MB/s ∼44% +24%
Acer Predator Triton 14 PT14-51
Micron 3400 MTFDKBA512TFH 512GB
1485 (1482.84min – 1485.29max) MB/s ∼36%
Average Micron 3400 MTFDKBA512TFH 512GB
(487 – 1522, n=8)
957 MB/s ∼23% -36%
Gigabyte Aero 14 OLED BMF
Gigabyte AG470S1TB-SI B10
3594 (3143.37min – 3593.51max) MB/s ∼100% +38%
MSI Stealth 14 Studio A13V
Samsung PM9A1 MZVL21T0HCLR
3545 (3517.45min – 3544.52max) MB/s ∼99% +36%
Razer Blade 14 RTX 4070
Samsung PM9A1 MZVL21T0HCLR
3545 (3530.25min – 3544.6max) MB/s ∼99% +36%
Acer Predator Triton 14 PT14-51
Micron 3400 MTFDKBA512TFH 512GB
2600 (2568.14min – 2600.25max) MB/s ∼72%
Average of class Gaming
(288 – 4869, n=199, last 2 years)
2095 MB/s ∼58% -19%
Asus ROG Zephyrus G14 GA402RJ
Micron 2450 1TB MTFDKBA1T0TFK
2074 (162.35min – 2073.69max) MB/s ∼58% -20%
Average Micron 3400 MTFDKBA512TFH 512GB
(333 – 2600, n=8)
1187 MB/s ∼33% -54%
MSI Stealth 14 Studio A13V
Samsung PM9A1 MZVL21T0HCLR
8719 Points ∼100% +57%
Razer Blade 14 RTX 4070
Samsung PM9A1 MZVL21T0HCLR
8693 Points ∼100% +56%
Gigabyte Aero 14 OLED BMF
Gigabyte AG470S1TB-SI B10
8118 Points ∼93% +46%
Asus ROG Zephyrus G14 GA402RJ
Micron 2450 1TB MTFDKBA1T0TFK
7311 Points ∼84% +31%
Average of class Gaming
(910 – 10745, n=188, last 2 years)
6459 Points ∼74% +16%
Acer Predator Triton 14 PT14-51
Micron 3400 MTFDKBA512TFH 512GB
5570 Points ∼64%
Average Micron 3400 MTFDKBA512TFH 512GB
(2483 – 5734, n=8)
4631 Points ∼53% -17%
Razer Blade 14 RTX 4070
Samsung PM9A1 MZVL21T0HCLR
3319 Points ∼100% +76%
MSI Stealth 14 Studio A13V
Samsung PM9A1 MZVL21T0HCLR
3275 Points ∼99% +74%
Gigabyte Aero 14 OLED BMF
Gigabyte AG470S1TB-SI B10
3263 Points ∼98% +73%
Asus ROG Zephyrus G14 GA402RJ
Micron 2450 1TB MTFDKBA1T0TFK
2687 Points ∼81% +43%
Average of class Gaming
(389 – 3980, n=188, last 2 years)
2413 Points ∼73% +28%
Acer Predator Triton 14 PT14-51
Micron 3400 MTFDKBA512TFH 512GB
1885 Points ∼57%
Average Micron 3400 MTFDKBA512TFH 512GB
(1126 – 1898, n=8)
1530 Points ∼46% -19%
MSI Stealth 14 Studio A13V
Samsung PM9A1 MZVL21T0HCLR
3821 Points ∼100% +36%
Razer Blade 14 RTX 4070
Samsung PM9A1 MZVL21T0HCLR
3753 Points ∼98% +34%
Asus ROG Zephyrus G14 GA402RJ
Micron 2450 1TB MTFDKBA1T0TFK
3248 Points ∼85% +16%
Gigabyte Aero 14 OLED BMF
Gigabyte AG470S1TB-SI B10
3205 Points ∼84% +14%
Average of class Gaming
(338 – 5157, n=188, last 2 years)
2863 Points ∼75% +2%
Acer Predator Triton 14 PT14-51
Micron 3400 MTFDKBA512TFH 512GB
2806 Points ∼73%
Average Micron 3400 MTFDKBA512TFH 512GB
(801 – 2912, n=8)
2391 Points ∼63% -15%
MSI Stealth 14 Studio A13V
Samsung PM9A1 MZVL21T0HCLR
5552 MB/s ∼100% +19%
Razer Blade 14 RTX 4070
Samsung PM9A1 MZVL21T0HCLR
5451.77 MB/s ∼98% +17%
Acer Predator Triton 14 PT14-51
Micron 3400 MTFDKBA512TFH 512GB
4653.97 MB/s ∼84%
Gigabyte Aero 14 OLED BMF
Gigabyte AG470S1TB-SI B10
4493.54 MB/s ∼81% -3%
Average of class Gaming
(925 – 12763, n=188, last 2 years)
4463 MB/s ∼80% -4%
Average Micron 3400 MTFDKBA512TFH 512GB
(3200 – 4909, n=8)
4389 MB/s ∼79% -6%
Asus ROG Zephyrus G14 GA402RJ
Micron 2450 1TB MTFDKBA1T0TFK
2999.71 MB/s ∼54% -36%
MSI Stealth 14 Studio A13V
Samsung PM9A1 MZVL21T0HCLR
4474 MB/s ∼100% +59%
Gigabyte Aero 14 OLED BMF
Gigabyte AG470S1TB-SI B10
4062.33 MB/s ∼91% +45%
Razer Blade 14 RTX 4070
Samsung PM9A1 MZVL21T0HCLR
3977.17 MB/s ∼89% +41%
Average of class Gaming
(308 – 11316, n=188, last 2 years)
3228 MB/s ∼72% +15%
Asus ROG Zephyrus G14 GA402RJ
Micron 2450 1TB MTFDKBA1T0TFK
2927.58 MB/s ∼65% +4%
Acer Predator Triton 14 PT14-51
Micron 3400 MTFDKBA512TFH 512GB
2811.06 MB/s ∼63%
Average Micron 3400 MTFDKBA512TFH 512GB
(1955 – 3592, n=8)
2705 MB/s ∼60% -4%
MSI Stealth 14 Studio A13V
Samsung PM9A1 MZVL21T0HCLR
80.2 MB/s ∼100% +42%
Gigabyte Aero 14 OLED BMF
Gigabyte AG470S1TB-SI B10
80.14 MB/s ∼100% +42%
Asus ROG Zephyrus G14 GA402RJ
Micron 2450 1TB MTFDKBA1T0TFK
73.57 MB/s ∼92% +30%
Razer Blade 14 RTX 4070
Samsung PM9A1 MZVL21T0HCLR
70.03 MB/s ∼87% +24%
Average of class Gaming
(20 – 108, n=188, last 2 years)
65.5 MB/s ∼82% +16%
Average Micron 3400 MTFDKBA512TFH 512GB
(52.4 – 63.4, n=8)
59.2 MB/s ∼74% +5%
Acer Predator Triton 14 PT14-51
Micron 3400 MTFDKBA512TFH 512GB
56.59 MB/s ∼71%
Acer Predator Triton 14 PT14-51
Micron 3400 MTFDKBA512TFH 512GB
225.83 MB/s ∼100%
Gigabyte Aero 14 OLED BMF
Gigabyte AG470S1TB-SI B10
206.22 MB/s ∼91% -9%
MSI Stealth 14 Studio A13V
Samsung PM9A1 MZVL21T0HCLR
206 MB/s ∼91% -9%
Average of class Gaming
(18 – 364, n=188, last 2 years)
197.2 MB/s ∼87% -13%
Asus ROG Zephyrus G14 GA402RJ
Micron 2450 1TB MTFDKBA1T0TFK
194.83 MB/s ∼86% -14%
Average Micron 3400 MTFDKBA512TFH 512GB
(116.6 – 226, n=8)
169.6 MB/s ∼75% -25%
Razer Blade 14 RTX 4070
Samsung PM9A1 MZVL21T0HCLR
167.46 MB/s ∼74% -26%
Gigabyte Aero 14 OLED BMF
Gigabyte AG470S1TB-SI B10
2733.5 MB/s ∼100% +101%
Razer Blade 14 RTX 4070
Samsung PM9A1 MZVL21T0HCLR
2704.2 MB/s ∼99% +98%
MSI Stealth 14 Studio A13V
Samsung PM9A1 MZVL21T0HCLR
2639 MB/s ∼97% +94%
Asus ROG Zephyrus G14 GA402RJ
Micron 2450 1TB MTFDKBA1T0TFK
2313.48 MB/s ∼85% +70%
Average of class Gaming
(216 – 3395, n=188, last 2 years)
1890 MB/s ∼69% +39%
Acer Predator Triton 14 PT14-51
Micron 3400 MTFDKBA512TFH 512GB
1362.92 MB/s ∼50%
Average Micron 3400 MTFDKBA512TFH 512GB
(656 – 1365, n=8)
1032 MB/s ∼38% -24%
Razer Blade 14 RTX 4070
Samsung PM9A1 MZVL21T0HCLR
3187.71 MB/s ∼100% +39%
MSI Stealth 14 Studio A13V
Samsung PM9A1 MZVL21T0HCLR
3167 MB/s ∼99% +38%
Asus ROG Zephyrus G14 GA402RJ
Micron 2450 1TB MTFDKBA1T0TFK
2760.09 MB/s ∼87% +20%
Gigabyte Aero 14 OLED BMF
Gigabyte AG470S1TB-SI B10
2592.88 MB/s ∼81% +13%
Average of class Gaming
(243 – 4381, n=188, last 2 years)
2349 MB/s ∼74% +2%
Acer Predator Triton 14 PT14-51
Micron 3400 MTFDKBA512TFH 512GB
2299.48 MB/s ∼72%
Average Micron 3400 MTFDKBA512TFH 512GB
(364 – 2451, n=8)
1950 MB/s ∼61% -15%
Acer Predator Triton 14 PT14-51
Micron 3400 MTFDKBA512TFH 512GB
0.077 ms * ∼100%
Asus ROG Zephyrus G14 GA402RJ
Micron 2450 1TB MTFDKBA1T0TFK
0.075 ms * ∼97% +3%
Gigabyte Aero 14 OLED BMF
Gigabyte AG470S1TB-SI B10
0.061 ms * ∼79% +21%
Average of class Gaming
(0.02 – 0.23, n=185, last 2 years)
0.05417 ms * ∼70% +30%
Average Micron 3400 MTFDKBA512TFH 512GB
(0.025 – 0.077, n=8)
0.05013 ms * ∼65% +35%
MSI Stealth 14 Studio A13V
Samsung PM9A1 MZVL21T0HCLR
0.041 ms * ∼53% +47%
Razer Blade 14 RTX 4070
Samsung PM9A1 MZVL21T0HCLR
0.039 ms * ∼51% +49%
Asus ROG Zephyrus G14 GA402RJ
Micron 2450 1TB MTFDKBA1T0TFK
0.169 ms * ∼100% -705%
Razer Blade 14 RTX 4070
Samsung PM9A1 MZVL21T0HCLR
0.074 ms * ∼44% -252%
Average of class Gaming
(0.012 – 1.028, n=188, last 2 years)
0.05705 ms * ∼34% -172%
Average Micron 3400 MTFDKBA512TFH 512GB
(0.019 – 0.074, n=8)
0.0425 ms * ∼25% -102%
Acer Predator Triton 14 PT14-51
Micron 3400 MTFDKBA512TFH 512GB
0.021 ms * ∼12%
MSI Stealth 14 Studio A13V
Samsung PM9A1 MZVL21T0HCLR
0.02 ms * ∼12% +5%
Gigabyte Aero 14 OLED BMF
Gigabyte AG470S1TB-SI B10
0.018 ms * ∼11% +14%
* … smaller is better
035571010651420177521302485284031953550390542604615497053255680603563906745Tooltip
The GeForce RTX 4050 laptop GPU offers 2,560 shaders, a 96-bit wide bus and fast GDDR6 RAM (6,144 MB). Acer has set the maximum TGP to 95 watts. According to the Witcher 3 test, the TGP is not maxed out.
The benchmark results are above the RTX 4050 average. However, this doesn’t apply when using the “Quiet” mode. The direct video output via the GeForce GPU doesn’t provide an increase in performance and switching between the dGPU and Optimus doesn’t require a reboot – Advanced Optimus is supported.
Asus ROG Zephyrus G14 GA402RJ
AMD Radeon RX 6700S, AMD Ryzen 7 6800HS
153853 Points ∼100% +10%
Acer Predator Triton 14 PT14-51
NVIDIA GeForce RTX 4050 Laptop GPU, Intel Core i7-13700H
139468 Points ∼91%
MSI Stealth 14 Studio A13V
NVIDIA GeForce RTX 4050 Laptop GPU, Intel Core i7-13700H
128703 Points ∼84% -8%
Average of class Gaming
(15902 – 192520, n=168, last 2 years)
125418 Points ∼82% -10%
Average NVIDIA GeForce RTX 4050 Laptop GPU
(51138 – 161152, n=15)
118345 Points ∼77% -15%
Gigabyte Aero 14 OLED BMF
NVIDIA GeForce RTX 4050 Laptop GPU, Intel Core i7-13700H
91970 Points ∼60% -34%
Razer Blade 14 RTX 4070
NVIDIA GeForce RTX 4070 Laptop GPU, AMD Ryzen 9 7940HS
30668 Points ∼100% +41%
Average of class Gaming
(781 – 53059, n=243, last 2 years)
27208 Points ∼89% +25%
Asus ROG Zephyrus G14 GA402RJ
AMD Radeon RX 6700S, AMD Ryzen 7 6800HS
24135 Points ∼79% +11%
Acer Predator Triton 14 PT14-51
NVIDIA GeForce RTX 4050 Laptop GPU, Intel Core i7-13700H
21742 Points ∼71%
MSI Stealth 14 Studio A13V
NVIDIA GeForce RTX 4050 Laptop GPU, Intel Core i7-13700H
21606 Points ∼70% -1%
Average NVIDIA GeForce RTX 4050 Laptop GPU
(14121 – 24007, n=21)
21171 Points ∼69% -3%
Gigabyte Aero 14 OLED BMF
NVIDIA GeForce RTX 4050 Laptop GPU, Intel Core i7-13700H
17061 Points ∼56% -22%
Razer Blade 14 RTX 4070
NVIDIA GeForce RTX 4070 Laptop GPU, AMD Ryzen 9 7940HS
12153 Points ∼100% +51%
Average of class Gaming
(224 – 22547, n=244, last 2 years)
10835 Points ∼89% +34%
Asus ROG Zephyrus G14 GA402RJ
AMD Radeon RX 6700S, AMD Ryzen 7 6800HS
8316 Points ∼68% +3%
Acer Predator Triton 14 PT14-51
NVIDIA GeForce RTX 4050 Laptop GPU, Intel Core i7-13700H
8069 Points ∼66%
Average NVIDIA GeForce RTX 4050 Laptop GPU
(5123 – 9040, n=21)
7743 Points ∼64% -4%
MSI Stealth 14 Studio A13V
NVIDIA GeForce RTX 4050 Laptop GPU, Intel Core i7-13700H
7560 Points ∼62% -6%
Gigabyte Aero 14 OLED BMF
NVIDIA GeForce RTX 4050 Laptop GPU, Intel Core i7-13700H
5675 Points ∼47% -30%
3DMark 06 Standard Score
52667 points3DMark 11 Performance
27364 points3DMark Cloud Gate Standard Score
61034 points3DMark Fire Strike Score
19711 points3DMark Time Spy Score
8580 points
Help
Gigabyte Aero 14 OLED BMF
NVIDIA GeForce RTX 4050 Laptop GPU, Intel Core i7-13700H
34 Seconds * ∼100% -26%
Average NVIDIA GeForce RTX 4050 Laptop GPU
(25 – 36, n=23)
28.6 Seconds * ∼84% -6%
MSI Stealth 14 Studio A13V
NVIDIA GeForce RTX 4050 Laptop GPU, Intel Core i7-13700H
28 Seconds * ∼82% -4%
Acer Predator Triton 14 PT14-51
NVIDIA GeForce RTX 4050 Laptop GPU, Intel Core i7-13700H
27 Seconds * ∼79%
Average of class Gaming
(9 – 142, n=114, last 2 years)
24 Seconds * ∼71% +11%
Razer Blade 14 RTX 4070
NVIDIA GeForce RTX 4070 Laptop GPU, AMD Ryzen 9 7940HS
22 Seconds * ∼65% +19%
MSI Stealth 14 Studio A13V
NVIDIA GeForce RTX 4050 Laptop GPU, Intel Core i7-13700H
175 Seconds * ∼100% -243%
Gigabyte Aero 14 OLED BMF
NVIDIA GeForce RTX 4050 Laptop GPU, Intel Core i7-13700H
62 Seconds * ∼35% -22%
Average NVIDIA GeForce RTX 4050 Laptop GPU
(47 – 175, n=23)
58.6 Seconds * ∼33% -15%
Acer Predator Triton 14 PT14-51
NVIDIA GeForce RTX 4050 Laptop GPU, Intel Core i7-13700H
51 Seconds * ∼29%
Average of class Gaming
(17 – 175, n=119, last 2 years)
40.2 Seconds * ∼23% +21%
Razer Blade 14 RTX 4070
NVIDIA GeForce RTX 4070 Laptop GPU, AMD Ryzen 9 7940HS
35 Seconds * ∼20% +31%
Razer Blade 14 RTX 4070
NVIDIA GeForce RTX 4070 Laptop GPU, AMD Ryzen 9 7940HS
115647 Points ∼100% +45%
Average of class Gaming
(4617 – 226512, n=244, last 2 years)
111388 Points ∼96% +40%
MSI Stealth 14 Studio A13V
NVIDIA GeForce RTX 4050 Laptop GPU, Intel Core i7-13700H
84836 Points ∼73% +6%
Average NVIDIA GeForce RTX 4050 Laptop GPU
(69499 – 90075, n=22)
82808 Points ∼72% +4%
Acer Predator Triton 14 PT14-51
NVIDIA GeForce RTX 4050 Laptop GPU, Intel Core i7-13700H
79823 Points ∼69%
Asus ROG Zephyrus G14 GA402RJ
AMD Radeon RX 6700S, AMD Ryzen 7 6800HS
73796 Points ∼64% -8%
Gigabyte Aero 14 OLED BMF
NVIDIA GeForce RTX 4050 Laptop GPU, Intel Core i7-13700H
70438 Points ∼61% -12%
Apple MacBook Pro 14 2023 M2 Pro Entry
Apple M2 Pro 16-Core GPU, Apple M2 Pro 10-Core
42483 Points ∼37% -47%
Razer Blade 14 RTX 4070
NVIDIA GeForce RTX 4070 Laptop GPU, AMD Ryzen 9 7940HS
71175 Points ∼100% +275%
Average of class Gaming
(1806 – 134644, n=243, last 2 years)
31871 Points ∼45% +68%
Asus ROG Zephyrus G14 GA402RJ
AMD Radeon RX 6700S, AMD Ryzen 7 6800HS
26537 Points ∼37% +40%
Average NVIDIA GeForce RTX 4050 Laptop GPU
(7921 – 50767, n=22)
21903 Points ∼31% +16%
Gigabyte Aero 14 OLED BMF
NVIDIA GeForce RTX 4050 Laptop GPU, Intel Core i7-13700H
19899 Points ∼28% +5%
MSI Stealth 14 Studio A13V
NVIDIA GeForce RTX 4050 Laptop GPU, Intel Core i7-13700H
19175 Points ∼27% +1%
Acer Predator Triton 14 PT14-51
NVIDIA GeForce RTX 4050 Laptop GPU, Intel Core i7-13700H
18961 Points ∼27%
Average of class Gaming
(171 – 3665, n=111, last 2 years)
1835 mpaths ∼100% +21%
Razer Blade 14 RTX 4070
NVIDIA GeForce RTX 4070 Laptop GPU, AMD Ryzen 9 7940HS
1655 mpaths ∼90% +9%
Acer Predator Triton 14 PT14-51
NVIDIA GeForce RTX 4050 Laptop GPU, Intel Core i7-13700H
1515 mpaths ∼83%
MSI Stealth 14 Studio A13V
NVIDIA GeForce RTX 4050 Laptop GPU, Intel Core i7-13700H
1410 mpaths ∼77% -7%
Average NVIDIA GeForce RTX 4050 Laptop GPU
(1021 – 1552, n=17)
1405 mpaths ∼77% -7%
Average of class Gaming
(120 – 2677, n=114, last 2 years)
1320 mpaths ∼100% +24%
Razer Blade 14 RTX 4070
NVIDIA GeForce RTX 4070 Laptop GPU, AMD Ryzen 9 7940HS
1194 mpaths ∼90% +12%
Acer Predator Triton 14 PT14-51
NVIDIA GeForce RTX 4050 Laptop GPU, Intel Core i7-13700H
1063 mpaths ∼81%
MSI Stealth 14 Studio A13V
NVIDIA GeForce RTX 4050 Laptop GPU, Intel Core i7-13700H
1044 mpaths ∼79% -2%
Average NVIDIA GeForce RTX 4050 Laptop GPU
(735 – 1123, n=17)
1016 mpaths ∼77% -4%
Acer Predator Triton 14 PT14-51
NVIDIA GeForce RTX 4050 Laptop GPU, Intel Core i7-13700H
12647 mpaths ∼100%
Razer Blade 14 RTX 4070
NVIDIA GeForce RTX 4070 Laptop GPU, AMD Ryzen 9 7940HS
12152 mpaths ∼96% -4%
MSI Stealth 14 Studio A13V
NVIDIA GeForce RTX 4050 Laptop GPU, Intel Core i7-13700H
11625 mpaths ∼92% -8%
Average of class Gaming
(1690 – 25897, n=138, last 2 years)
11623 mpaths ∼92% -8%
Average NVIDIA GeForce RTX 4050 Laptop GPU
(3562 – 14401, n=17)
10418 mpaths ∼82% -18%
Average of class Gaming
(51 – 1334, n=201, last 2 years)
494 mpaths ∼100% +2%
Acer Predator Triton 14 PT14-51
NVIDIA GeForce RTX 4050 Laptop GPU, Intel Core i7-13700H
482 mpaths ∼98%
MSI Stealth 14 Studio A13V
NVIDIA GeForce RTX 4050 Laptop GPU, Intel Core i7-13700H
477 mpaths ∼97% -1%
Average NVIDIA GeForce RTX 4050 Laptop GPU
(340 – 529, n=19)
463 mpaths ∼94% -4%
Gigabyte Aero 14 OLED BMF
NVIDIA GeForce RTX 4050 Laptop GPU, Intel Core i7-13700H
363 mpaths ∼73% -25%
Asus ROG Zephyrus G14 GA402RJ
AMD Radeon RX 6700S, AMD Ryzen 7 6800HS
73 mpaths ∼15% -85%
Acer Predator Triton 14 PT14-51
NVIDIA GeForce RTX 4050 Laptop GPU, Intel Core i7-13700H
19120 ksamples ∼100%
MSI Stealth 14 Studio A13V
NVIDIA GeForce RTX 4050 Laptop GPU, Intel Core i7-13700H
18106 ksamples ∼95% -5%
Average of class Gaming
(2741 – 37629, n=201, last 2 years)
16632 ksamples ∼87% -13%
Average NVIDIA GeForce RTX 4050 Laptop GPU
(5413 – 24181, n=19)
15244 ksamples ∼80% -20%
Gigabyte Aero 14 OLED BMF
NVIDIA GeForce RTX 4050 Laptop GPU, Intel Core i7-13700H
14800 ksamples ∼77% -23%
Asus ROG Zephyrus G14 GA402RJ
AMD Radeon RX 6700S, AMD Ryzen 7 6800HS
13237 ksamples ∼69% -31%
Average of class Gaming
(2.93 – 231, n=22, last 2 years)
36.5 fps ∼100% +76%
Average NVIDIA GeForce RTX 4050 Laptop GPU
(20.7 – 21.4, n=2)
21.1 fps ∼58% +2%
Acer Predator Triton 14 PT14-51
NVIDIA GeForce RTX 4050 Laptop GPU, Intel Core i7-13700H
20.7 fps ∼57%
Average of class Gaming
(23.5 – 59.9, n=22, last 2 years)
39.3 fps ∼100% +31%
Acer Predator Triton 14 PT14-51
NVIDIA GeForce RTX 4050 Laptop GPU, Intel Core i7-13700H
30.1 fps ∼77%
Average NVIDIA GeForce RTX 4050 Laptop GPU
(28.7 – 30.1, n=2)
29.4 fps ∼75% -2%
Average of class Gaming
(99.8 – 611, n=20, last 2 years)
357 fps ∼100% +23%
Average NVIDIA GeForce RTX 4050 Laptop GPU
(291 – 334, n=2)
313 fps ∼88% +8%
Acer Predator Triton 14 PT14-51
NVIDIA GeForce RTX 4050 Laptop GPU, Intel Core i7-13700H
291.1 fps ∼82%
Average of class Gaming
(20.6 – 76.5, n=22, last 2 years)
38 fps ∼100% +35%
Average NVIDIA GeForce RTX 4050 Laptop GPU
(28.2 – 28.7, n=2)
28.5 fps ∼75% +1%
Acer Predator Triton 14 PT14-51
NVIDIA GeForce RTX 4050 Laptop GPU, Intel Core i7-13700H
28.2 fps ∼74%
Average of class Gaming
(44 – 139, n=21, last 2 years)
98.6 fps ∼100% +12%
Average NVIDIA GeForce RTX 4050 Laptop GPU
(88.1 – 94.5, n=2)
91.3 fps ∼93% +4%
Acer Predator Triton 14 PT14-51
NVIDIA GeForce RTX 4050 Laptop GPU, Intel Core i7-13700H
88.1 fps ∼89%
Average of class Gaming
(17.8 – 743, n=22, last 2 years)
96.5 fps ∼100% +97%
Average NVIDIA GeForce RTX 4050 Laptop GPU
(49.1 – 50.7, n=2)
49.9 fps ∼52% +2%
Acer Predator Triton 14 PT14-51
NVIDIA GeForce RTX 4050 Laptop GPU, Intel Core i7-13700H
49.1 fps ∼51%
Average of class Gaming
(25.7 – 213, n=22, last 2 years)
116.7 fps ∼100% +53%
Average NVIDIA GeForce RTX 4050 Laptop GPU
(76.2 – 79.7, n=2)
78 fps ∼67% +2%
Acer Predator Triton 14 PT14-51
NVIDIA GeForce RTX 4050 Laptop GPU, Intel Core i7-13700H
76.2 fps ∼65%
* … smaller is better
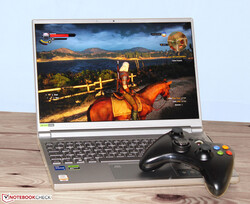
The Predator’s hardware is intended for FHD gaming at high to maximum settings. Nevertheless, the screen’s maximum resolution (2,560 x 1,600 pixels) can be taken advantage of – at sometimes lower settings. We measured frame rates above the RTX 4050 average.
Razer Blade 14 RTX 4070
AMD Ryzen 9 7940HS, NVIDIA GeForce RTX 4070 Laptop GPU
109.5 (103min) fps ∼100% +37%
Average of class Gaming
(8.61 – 216, n=241, last 2 years)
104.4 fps ∼95% +30%
Asus ROG Zephyrus G14 GA402RJ
AMD Ryzen 7 6800HS, AMD Radeon RX 6700S
84.3 (69min) fps ∼77% +5%
Acer Predator Triton 14 PT14-51
Intel Core i7-13700H, NVIDIA GeForce RTX 4050 Laptop GPU
80.1 (68min) fps ∼73%
MSI Stealth 14 Studio A13V
Intel Core i7-13700H, NVIDIA GeForce RTX 4050 Laptop GPU
76.7 (74min, 74P1) fps ∼70% -4%
Average NVIDIA GeForce RTX 4050 Laptop GPU
(18.5 – 89, n=26)
74.7 fps ∼68% -7%
Gigabyte Aero 14 OLED BMF
Intel Core i7-13700H, NVIDIA GeForce RTX 4050 Laptop GPU
71 fps ∼65% -11%
Gigabyte Aero 14 OLED BMF
Intel Core i7-13700H, NVIDIA GeForce RTX 4050 Laptop GPU
67.7 (63min, 65P1) fps ∼62% -15%
Apple MacBook Pro 14 2023 M2 Pro Entry
Apple M2 Pro 10-Core, Apple M2 Pro 16-Core GPU
45 fps ∼41% -44%
Razer Blade 14 RTX 4070
AMD Ryzen 9 7940HS, NVIDIA GeForce RTX 4070 Laptop GPU
203 (69.2min, 151.6P1) fps ∼100% +48%
Average of class Gaming
(13.8 – 421, n=236, last 2 years)
183.3 fps ∼90% +34%
Asus ROG Zephyrus G14 GA402RJ
AMD Ryzen 7 6800HS, AMD Radeon RX 6700S
157.3 (108.2min, 113.2P1) fps ∼77% +15%
Acer Predator Triton 14 PT14-51
Intel Core i7-13700H, NVIDIA GeForce RTX 4050 Laptop GPU
137 (47.7min, 98.8P1) fps ∼67%
Average NVIDIA GeForce RTX 4050 Laptop GPU
(21.2 – 156.6, n=21)
132.6 fps ∼65% -3%
MSI Stealth 14 Studio A13V
Intel Core i7-13700H, NVIDIA GeForce RTX 4050 Laptop GPU
123.1 (19.3min, 35P1) fps ∼61% -10%
Gigabyte Aero 14 OLED BMF
Intel Core i7-13700H, NVIDIA GeForce RTX 4050 Laptop GPU
100.2 (67.8min, 76.1P1) fps ∼49% -27%
Average of class Gaming
(35.6 – 126.7, n=15, last 2 years)
78.4 fps ∼100% +68%
Acer Predator Triton 14 PT14-51
Intel Core i7-13700H, NVIDIA GeForce RTX 4050 Laptop GPU
46.7 fps ∼60%
Average NVIDIA GeForce RTX 4050 Laptop GPU
(29.5 – 46.7, n=3)
39.4 fps ∼50% -16%
Average of class Gaming
(48.4 – 150.7, n=17, last 2 years)
95.3 fps ∼100% +51%
Acer Predator Triton 14 PT14-51
Intel Core i7-13700H, NVIDIA GeForce RTX 4050 Laptop GPU
63.1 fps ∼66%
Average NVIDIA GeForce RTX 4050 Laptop GPU
(41.4 – 63.1, n=3)
54.5 fps ∼57% -14%
Average of class Gaming
(32 – 79.6, n=13, last 2 years)
55.1 fps ∼100% +10%
Acer Predator Triton 14 PT14-51
Intel Core i7-13700H, NVIDIA GeForce RTX 4050 Laptop GPU
49.9 fps ∼91%
Average NVIDIA GeForce RTX 4050 Laptop GPU
(31 – 49.9, n=3)
41.6 fps ∼75% -17%
Average of class Gaming
(48.4 – 117.4, n=11, last 2 years)
65.2 fps ∼100% +35%
Average NVIDIA GeForce RTX 4050 Laptop GPU
(48.4 – 56, n=6)
51.3 fps ∼79% +6%
Medion Erazer Scout E20
Intel Core i7-13700H, NVIDIA GeForce RTX 4050 Laptop GPU
49.4 (18.6min, 24.4P0.1, 34.6P1) fps ∼76% +2%
Acer Predator Triton 14 PT14-51
Intel Core i7-13700H, NVIDIA GeForce RTX 4050 Laptop GPU
48.4 (11.3min, 16.9P0.1, 29P1) fps ∼74%
Average of class Gaming
(30.4 – 84.4, n=9, last 2 years)
44.7 fps ∼100% +47%
Average NVIDIA GeForce RTX 4050 Laptop GPU
(30.4 – 35, n=4)
32.2 fps ∼72% +6%
Acer Predator Triton 14 PT14-51
Intel Core i7-13700H, NVIDIA GeForce RTX 4050 Laptop GPU
30.4 (11.6min, 13.8P0.1, 19P1) fps ∼68%
Average of class Gaming
(38.6 – 85.3, n=6, last 2 years)
51.6 fps ∼100% +34%
Average NVIDIA GeForce RTX 4050 Laptop GPU
(38.6 – 42, n=4)
40.4 fps ∼78% +5%
Medion Erazer Scout E20
Intel Core i7-13700H, NVIDIA GeForce RTX 4050 Laptop GPU
39.5 (5.19min, 9.04P0.1, 23P1) fps ∼77% +2%
Acer Predator Triton 14 PT14-51
Intel Core i7-13700H, NVIDIA GeForce RTX 4050 Laptop GPU
38.6 (10.5min, 12.5P0.1, 20.8P1) fps ∼75%
Average of class Gaming
(39.5 – 100, n=7, last 2 years)
56.8 fps ∼100% +40%
Average NVIDIA GeForce RTX 4050 Laptop GPU
(39.5 – 51.1, n=6)
44.8 fps ∼79% +11%
Acer Predator Triton 14 PT14-51
Intel Core i7-13700H, NVIDIA GeForce RTX 4050 Laptop GPU
40.5 (12min, 31P1) fps ∼71%
Average of class Gaming
(31 – 45, n=6, last 2 years)
37.8 fps ∼100% +22%
Average NVIDIA GeForce RTX 4050 Laptop GPU
(30 – 40.8, n=6)
35.3 fps ∼93% +14%
Acer Predator Triton 14 PT14-51
Intel Core i7-13700H, NVIDIA GeForce RTX 4050 Laptop GPU
31 (21min, 24P1) fps ∼82%
Average of class Gaming
(61.8 – 178.5, n=5, last 2 years)
103.2 fps ∼100% +67%
Average NVIDIA GeForce RTX 4050 Laptop GPU
(61.8 – 76.5, n=2)
69.2 fps ∼67% +12%
Acer Predator Triton 14 PT14-51
Intel Core i7-13700H, NVIDIA GeForce RTX 4050 Laptop GPU
61.8 (13.4min, 16.6P0.1, 37.5P1) fps ∼60%
Average of class Gaming
(90.9 – 181.7, n=7, last 2 years)
128.3 fps ∼100% +41%
Medion Erazer Scout E20
Intel Core i7-13700H, NVIDIA GeForce RTX 4050 Laptop GPU
120.6 (19.9min, 21.9P0.1, 82.1P1) fps ∼94% +33%
Average NVIDIA GeForce RTX 4050 Laptop GPU
(90.9 – 133.5, n=3)
115 fps ∼90% +27%
Acer Predator Triton 14 PT14-51
Intel Core i7-13700H, NVIDIA GeForce RTX 4050 Laptop GPU
90.9 (15.1min, 20.6P0.1, 50.8P1) fps ∼71%
In order to check whether the frame rates remain stable over a longer period of time, we ran the Witcher 3 game for around 60 minutes at FullHD resolution and maximum quality settings. The game character was not moved and we did not detect a dip in the frame rate.
0102030405060708090100110Tooltip
low
med.
high
ultraQHDThe Witcher 3 (2015)
393.7
253.3
149.7
80.1
Dota 2 Reborn (2015)
159.4
141.8
132.6
127.2
Final Fantasy XV Benchmark (2018)
183
110.5
79.2
58.2
X-Plane 11.11 (2018)
138.1
128.6
100.2
Far Cry 5 (2018)
174
131
122
113
79
Strange Brigade (2018)
467
194.8
159.4
137
94.9
F1 22 (2022)
210
194.4
147.2
48.5
31
The Callisto Protocol (2022)
119
96
93.3
63.1
46.7
The Last of Us (2023)
82.2
67.4
56.2
42.8
Dead Island 2 (2023)
201
171.8
125.9
90.9
61.8
Star Wars Jedi Survivor (2023)
60.6
54.6
51.6
48.4
30.4
F1 23 (2023)
197.9
194.8
139.8
40.5
31
In everyday use (office, internet, …) the Triton usually runs quietly – irrespective of the selected mode. The noise level can increase to up to 56 dB(A) (“Turbo”) and 53 dB(A) (“Performance”), respectively. We used the “Balanced” and recorded a moderate 43 dB(A). Overall, lower noise production can be achieved by applying the “Quiet” mode – with a relatively small drop in performance.
Noise Level
Idle
27 / 29 / 31 dB(A)
Load
42 / 45 dB(A)

30 dB
silent
40 dB(A)
audible
50 dB(A)
loud
min: ![]() , med:
, med: ![]() , max:
, max: ![]() Earthworks M23R, Arta (15 cm distance) environment noise: 25 dB(A)
Earthworks M23R, Arta (15 cm distance) environment noise: 25 dB(A)
dB(A)
0102030405060708090Deep BassMiddle BassHigh BassLower RangeMidsHigher MidsLower HighsMid HighsUpper HighsSuper Highs2041.132.743.137.735.742.52538.934.83835.433.436.231464247.642.134.8454033.125.328.726.127.332.15041.719.821.121.94042.56328.921.922.524.222.931.18024.819.418.618.721.626.610023.118.217.116.71828.912524.122.62020.616.730.516026.926.625.424.319.129.720030.623.523.52322.435.225028.621.819.520.418.429.331525.919.51816.815.127.640028.419.819.41813.230.250030.122.520.918.612.732.863031.422.120.218.312.634.180033.723.620.517.612.336.1100034.623.519.316.812.238.41250332016.415.311.535.9160030.818.715.614.211.334.7200030.518.216.114.912.134250027.316.615.113.812.430.5315026.215.414.813.312.529.1400026.214.414.513.612.829.6500025.314.514.613.813.830.5630022.714.21414.213.826.6800018.614.114.215.715.922.41000016.913.613.714.814.219.11250015.91313.213.913.915.81600016.512.612.913.312.913.9SPL41.6312927.725.544.9N3.71.41.210.74.9median 26.9median 18.7median 16.4median 15.7median 13.2median 30.2Delta4.53.92.82.21.75hearing rangehide median Fan NoiseAcer Predator Triton 14 PT14-51
Under load, the laptop heats up noticeably. At several measuring points, we recorded temperatures between 50 and 56 °C. When it comes to everyday use, these figures are in the green zone.
53 °C
127 F54 °C
129 F49 °C
120 F 51 °C
124 F52 °C
126 F47 °C
117 F 41 °C
106 F40 °C
104 F41 °C
106 F
Maximum: 54 °C=129 F
Average: 47.6 °C=118 F
55 °C
131 F56 °C
133 F51 °C
124 F49 °C
120 F51 °C
124 F44 °C
111 F41 °C
106 F40 °C
104 F40 °C
104 F
Maximum: 56 °C=133 F
Average: 47.4 °C=117 F
Power Supply (max.) 47 °C=117 F | Room Temperature 21 °C=70 F | Fluke t3000FC (calibrated), Voltcraft IR-900
(-) The average temperature for the upper side under maximal load is 47.6 °C / 118 F, compared to the average of 33.9 °C / 93 F for the devices in the class Gaming.
(-) The maximum temperature on the upper side is 54 °C / 129 F, compared to the average of 40.4 °C / 105 F, ranging from 21.2 to 68.8 °C for the class Gaming.
(-) The bottom heats up to a maximum of 56 °C / 133 F, compared to the average of 43.2 °C / 110 F
(+) In idle usage, the average temperature for the upper side is 29.1 °C / 84 F, compared to the device average of 33.9 °C / 93 F.
(-) Playing The Witcher 3, the average temperature for the upper side is 46.7 °C / 116 F, compared to the device average of 33.9 °C / 93 F.
(-) The palmrests and touchpad can get very hot to the touch with a maximum of 41 °C / 105.8 F.
(-) The average temperature of the palmrest area of similar devices was 29 °C / 84.2 F (-12 °C / -21.6 F).
The stress test (Prime95 and Furmark in continuous operation) is an extreme scenario which examines the system stability under full load. The CPU clock speed drops initially from 4.4 to 4.5 GHz (P) and 3.1 GHz (E) and then gradually from 2.1 to 2.2 GHz (P) and 1.3 GHz (E). The GPU clock speed levels off at 1,750 at 1,800 MHz.
The stereo speakers produce decent sound which is mostly free of any bass. A better audio experience could be achieved by using headphones or an external speaker.
dB(A)
0102030405060708090Deep BassMiddle BassHigh BassLower RangeMidsHigher MidsLower HighsMid HighsUpper HighsSuper Highs2035.737.32533.434.93134.841.24027.328.6504041.36322.928.28021.622.1100182712516.738.116019.146.620022.449.625018.454.631515.157.840013.260.550012.761.563012.663.880012.363.6100012.264.9125011.568.1160011.373.2200012.172.9250012.467.4315012.569.2400012.864.3500013.862.9630013.867.6800015.968.91000014.263.21250013.964.21600012.962.1SPL25.580.3N0.746.6median 13.2median 63.6Delta1.76.435.441.435.429.827.929.823.523.123.522.12022.120.725.420.724.123.724.123.224.223.229.520.729.535.717.135.74615.14652.114.352.157.413.157.460.913.660.96112.96162.11162.163.111.463.165.59.565.568.59.868.568.59.868.569.79.969.773.510.373.575.410.575.474.811.374.871.111.671.170.11270.162.811.962.864.712.564.761.31361.360.611.960.657.411.157.482.723.482.751.30.551.3median 62.8median 11.9median 62.86.51.56.5hearing rangehide median Pink NoiseAcer Predator Triton 14 PT14-51Razer Blade 14 RTX 4070
Frequency diagram (checkboxes can be checked and unchecked to compare devices)
Acer Predator Triton 14 PT14-51 audio analysis
(±) | speaker loudness is average but good (80 dB)
Bass 100 – 315 Hz
(-) | nearly no bass – on average 18% lower than median
(±) | linearity of bass is average (11.8% delta to prev. frequency)
Mids 400 – 2000 Hz
(+) | balanced mids – only 3.7% away from median
(+) | mids are linear (4% delta to prev. frequency)
Highs 2 – 16 kHz
(+) | balanced highs – only 2.9% away from median
(±) | linearity of highs is average (7.2% delta to prev. frequency)
Overall 100 – 16.000 Hz
(±) | linearity of overall sound is average (15.4% difference to median)
Compared to same class
» 30% of all tested devices in this class were better, 7% similar, 63% worse
» The best had a delta of 7%, average was 19%, worst was 132%
Compared to all devices tested
» 17% of all tested devices were better, 3% similar, 80% worse
» The best had a delta of 4%, average was 26%, worst was 134%
Razer Blade 14 RTX 4070 audio analysis
(+) | speakers can play relatively loud (82.7 dB)
Bass 100 – 315 Hz
(-) | nearly no bass – on average 15.9% lower than median
(±) | linearity of bass is average (12.3% delta to prev. frequency)
Mids 400 – 2000 Hz
(+) | balanced mids – only 4.3% away from median
(+) | mids are linear (3.1% delta to prev. frequency)
Highs 2 – 16 kHz
(±) | higher highs – on average 6.2% higher than median
(+) | highs are linear (5.5% delta to prev. frequency)
Overall 100 – 16.000 Hz
(±) | linearity of overall sound is average (16.7% difference to median)
Compared to same class
» 39% of all tested devices in this class were better, 10% similar, 51% worse
» The best had a delta of 7%, average was 19%, worst was 132%
Compared to all devices tested
» 22% of all tested devices were better, 7% similar, 71% worse
» The best had a delta of 4%, average was 26%, worst was 134%
Nothing abnormal can be said regarding the computer’s power consumption. The results find themselves in a normal range for the installed hardware. The stress test and Witcher 3 test were run with either dropping or constant power consumption. The PSU (230-watt) is more than adequately-sized.
Acer Predator Triton 14 PT14-51
i7-13700H, NVIDIA GeForce RTX 4050 Laptop GPURazer Blade 14 RTX 4070
R9 7940HS, NVIDIA GeForce RTX 4070 Laptop GPUAsus ROG Zephyrus G14 GA402RJ
R7 6800HS, Radeon RX 6700SMSI Stealth 14 Studio A13V
i7-13700H, NVIDIA GeForce RTX 4050 Laptop GPUGigabyte Aero 14 OLED BMF
i7-13700H, NVIDIA GeForce RTX 4050 Laptop GPUApple MacBook Pro 14 2023 M2 Pro Entry
M2 Pro 10-Core, M2 Pro 16-Core GPUAverage NVIDIA GeForce RTX 4050 Laptop GPU
Average of class Gaming
Idle Minimum *
12
19.5
-63%
12
-0%
10.4
13%
7.4
38%
2.5
79%
9.81 ?(3 – 19, n=15)
18%
13.6 ?(3 – 64, n=188, last 2 years)
-13%
Idle Average *
14
24.7
-76%
18
-29%
19.1
-36%
8.3
41%
12.1
14%
13.7 ?(5 – 20, n=15)
2%
18.7 ?(6.5 – 68.2, n=188, last 2 years)
-34%
Idle Maximum *
26
27
-4%
26
-0%
19.4
25%
8.7
67%
12.3
53%
17.6 ?(8.7 – 26, n=15)
32%
25.9 ?(8.9 – 76, n=187, last 2 years)
-0%
Load Average *
88
83.2
5%
88
-0%
95.9
-9%
76
14%
49.8
43%
92.9 ?(72 – 151, n=15)
-6%
113.1 ?(48.4 – 202, n=188, last 2 years)
-29%
Witcher 3 ultra *
114.9
165.8
-44%
157.7
-37%
141.6
-23%
70
39%
46.6
59%
Load Maximum *
213
204.5
4%
194
9%
203
5%
132
38%
71.4
66%
181.1 ?(104.2 – 280, n=15)
15%
240 ?(99 – 418, n=187, last 2 years)
-13%
* … smaller is better
0102030405060708090100110120130140150160170Tooltip
0102030405060708090100110120130140150160Tooltip
In the Wi-Fi test (loading websites with the help of a script) and video test (the Big Buck Bunny short film (H.264 coding, FHD) in a loop), the 14-inch device achieved runtimes of 5 hours 2 minutes and 8 hours 59 minutes, respectively. During both tests, the laptop’s energy-saving functions were deactivated and the display brightness was set to around 150 cd/m². In addition, the video test was carried out with the radio module switched off.
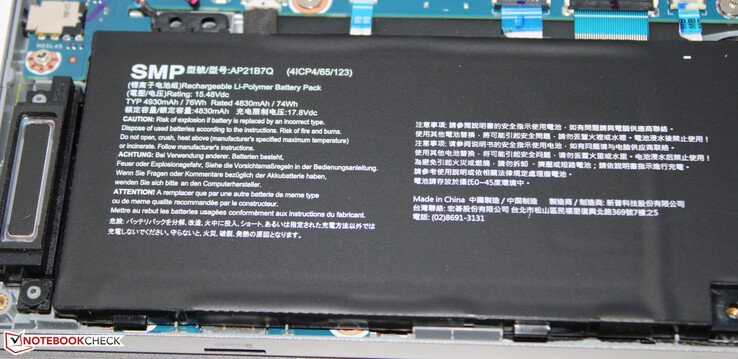 The battery has a capacity of 76 Wh.
Battery Runtime
Idle (without WLAN, min brightness)
11h 9min
WiFi Websurfing (Edge 114)
5h 02min
Big Buck Bunny H.264 1080p
8h 59min
Load (maximum brightness)
1h 49min
Acer Predator Triton 14 PT14-51
i7-13700H, NVIDIA GeForce RTX 4050 Laptop GPU, 76.3 WhRazer Blade 14 RTX 4070
R9 7940HS, NVIDIA GeForce RTX 4070 Laptop GPU, 68 WhAsus ROG Zephyrus G14 GA402RJ
R7 6800HS, Radeon RX 6700S, 76 WhMSI Stealth 14 Studio A13V
i7-13700H, NVIDIA GeForce RTX 4050 Laptop GPU, 72 WhGigabyte Aero 14 OLED BMF
i7-13700H, NVIDIA GeForce RTX 4050 Laptop GPU, 63 WhApple MacBook Pro 14 2023 M2 Pro Entry
M2 Pro 10-Core, M2 Pro 16-Core GPU, 70 WhAverage of class Gaming
Reader / Idle
669
513
-23%
678
1%
556 ?(57 – 1217, n=94, last 2 years)
-17%
H.264
539
396
-27%
982
82%
378 ?(56 – 747, n=97, last 2 years)
-30%
WiFi v1.3
302
374
24%
612
103%
378
25%
457
51%
774
156%
359 ?(57 – 745, n=184, last 2 years)
19%
Load
109
59
-46%
69
-37%
92
-16%
85.3 ?(36 – 228, n=157, last 2 years)
-22%
Pros
+ bright 16:10 aspect ratio WQXGA display
+ 165 Hz panel with G-Sync support
+ PCIe 4 SSD
+ backlit keyboard (RGB)
+ thermal paste made from liquid metal
+ Thunderbolt 4
+ Power Delivery
Cons
– can get loud under load
– low storage
– RAM cannot be expanded/swapped
– slow memory card reader
 The Acer Predator Triton 14 PT14-51-753L was provided by Acer Germany.
The 14-inch laptop’s main applications ought to be in the areas of rendering and gaming. The Core i7-13700H and the GeForce RTX 4050 provide the necessary power with both chips running at a consistently high clock speed. If more graphics power is required, Acer also has GeForce RTX 4070 variants on offer.
A ton of computational power in a 14-inch frame: With the Predator Triton 14, Acer has delivered a potent laptop.
The laptop gets noticeably warm and can produce a considerable amount of noise. We primarily used the “Balanced” system mode and it ensured only moderate background noise with relatively small performance loss.
Overall, the 16:10 display (2,560 x 1,600 pixels, IPS, 165 Hz, G-Sync) is impressive. Stand-out points include its high brightness and DCI P3 coverage. These are joined by real-life battery runtimes of 5 to 9 hours. Positive: The battery can be charged via the USB-C mains adapter (min. 65-watt, 20 V). Power Delivery is supported. This means you don’t have to be accompanied by the proprietary PSU (230-watt) wherever you go.
The Predator’s weaknesses lie mainly in its storage: A meagre SSD capacity (512 GB), no space for additional SSDs, soldered RAM with no expansion possibilities and a very slow-running memory card reader. All in all, more should be expected of a laptop in this price category.
An alternative could come in the shape of the MSI Stealth 14 Studio A13V. It is equipped with the same CPU and GPU, offering a little more power than the Predator and scores extra points for its two RAM banks. However, at a price of around $2,000, it’s not one of the cheapest devices.
Acer Predator Triton 14 PT14-51
–
07/24/2023 v7
Sascha Mölck
Connectivity
67 / 80 → 84%
Application Performance
93%
Gaming – Weighted Average
Transparency
The present review sample was made available to the author as a loan by the manufacturer or a shop for the purposes of review. The lender had no influence on this review, nor did the manufacturer receive a copy of this review before publication. There was no obligation to publish this review.

Editor of the original article: Sascha Mölck – Senior Tech Writer – 967 articles published on Notebookcheck since 2012
What started as a side job during my computer science studies later became my main job: For more than 20 years now I have been working as an editor and author in the IT sector. While working in the print sector I also contributed to the creation of various loose-leaf publications and published original written pieces. I have been working for Notebookcheck since 2012.

Translator: Andrew Dickson – Translator – 53 articles published on Notebookcheck since 2022
My lifelong passion for tech was born in a gadget-filled household in Scotland. From games consoles to cameras to computers. Early adopters, so early the phrase might have been coined with our family in mind.
On finishing school, I trained and qualified as a golf professional before moving to Germany, where I have worked and lived for over 30 years.
In 2002, I formed a successful English language centre, providing training, translations and digital learning systems to numerous businesses in the Rhein Neckar metropole area.
Whether augmented or virtual reality, smart devices, mobile technology, sustainable environmental solutions, the tech world is as exciting now as it has ever been.
Working with Notebookcheck allows me to combine my love of both tech and language.
Sascha Mölck, 2023-07-26 (Update: 2023-07-27)
>>> Read full article>>>
Copyright for syndicated content belongs to the linked Source : NotebookCheck – https://www.notebookcheck.net/Acer-Predator-Triton-14-reviewed-A-14-inch-gaming-laptop-with-a-bright-display-and-an-RTX-4050.736193.0.html

